To navigate to the Systems View -
Use the Menu button to select a System.

System Snapshot
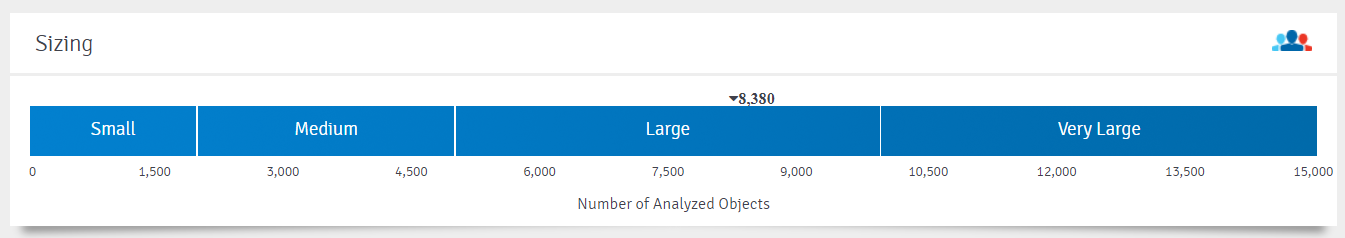
The first report shows a snapshot of your ERP system, including its relative size alongside object-related info. Panaya displays all the information you need to compare your system with other ERPs out there.
Take a look at the Analyzed Objects and -
Filter by Origin (1) - Standard, Custom, or 3rd Party
Change the bar graph (2) to display the objects by their Type, Module, Origin, or Package
Group by Usage Level (3) or by Origin to change the color legend to reflect the object that origin from Standard, Custom, or 3rd Party code
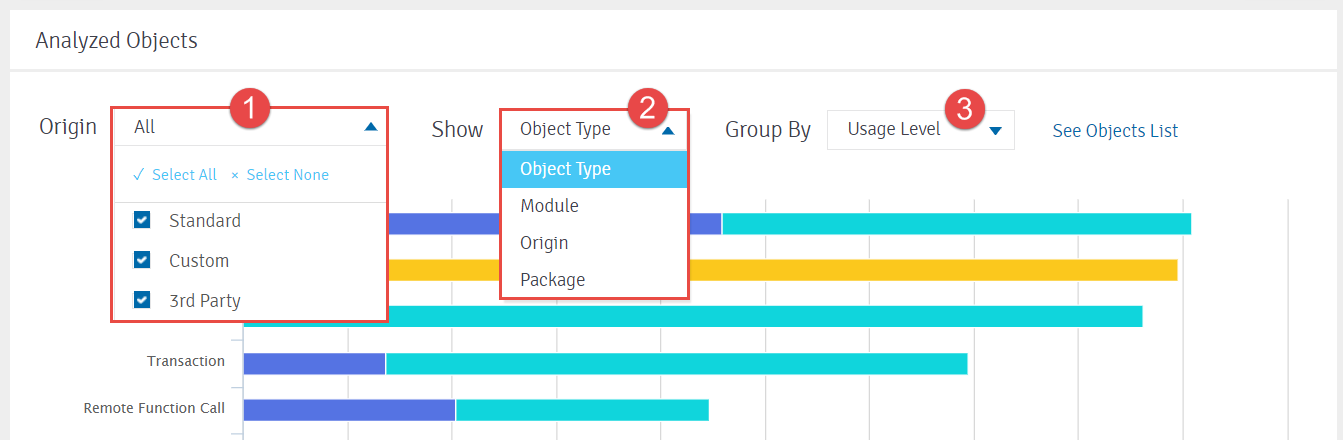
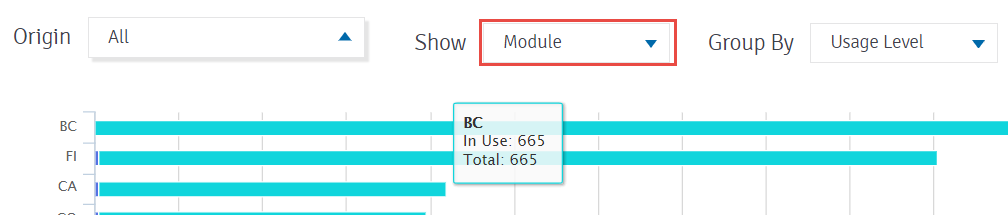
Click on any section in a bar to drill down to the list of objects
Use the legend to eliminate Objects by Usage or Origin

Good to Know!
Only custom Security Roles with active usage appear in the system snapshot bar chart. This eliminates visual distractions when a large number of auto-generated security roles are unused.
However, the complete snapshot inventory includes a broader set of custom security roles, including all roles with at least one user attached (including both used and unused roles).
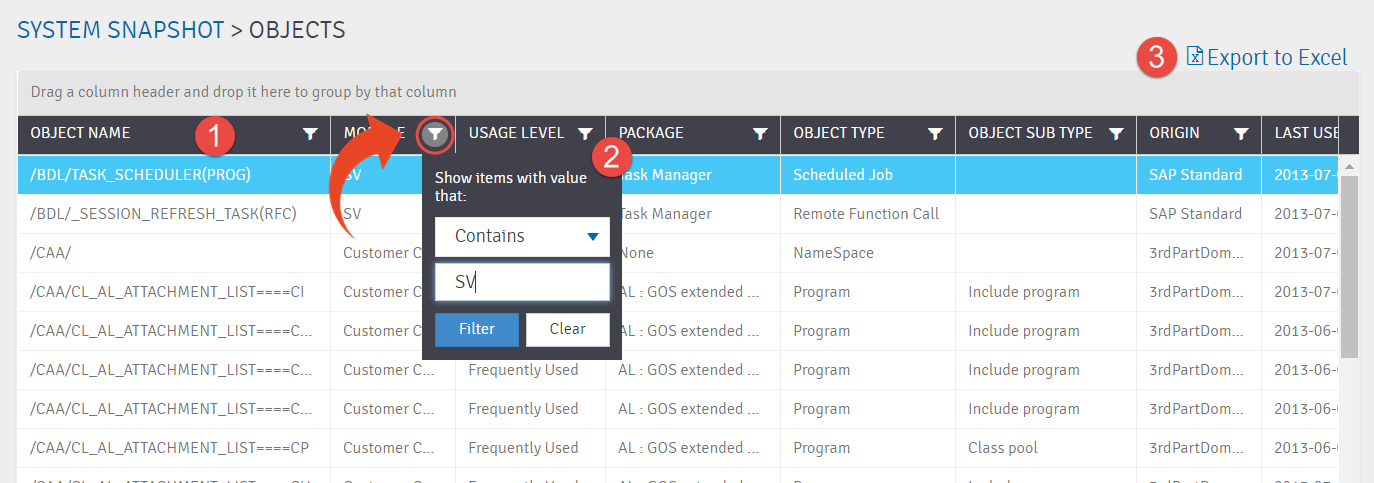
Object List
To view all objects, click on See Object List.
You can also click on any section in the bar graph to drill down to the list of filtered objects
To sort by column, click on the column header (1)
For advanced filtering options, click on the filtering icon(2) for each column
Use the Export to Excel (3) option to export your filtered list
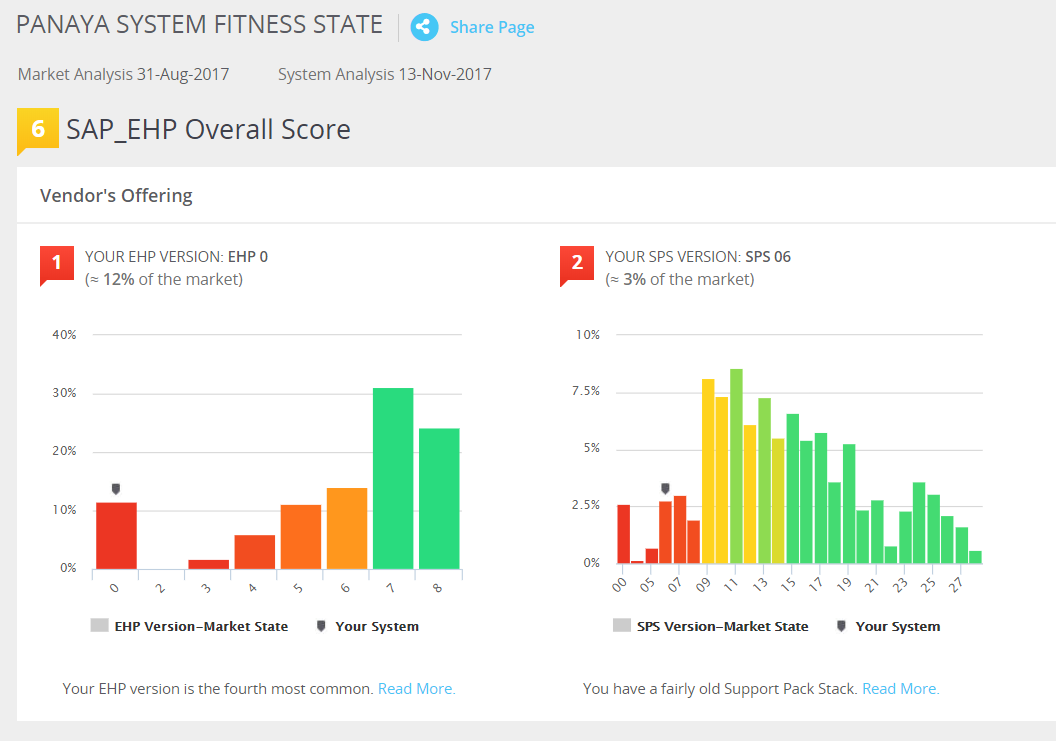
System Fitness State
This helps you understand and determine your system readiness for future changes by comparing your system with other similar systems in the market (based on over 5,000 ERP systems analyzed by Panaya).
Using all the parameters of your system plus the status of your custom code, Panaya can give you a System Fitness State (indicating how well prepared your ERP is for future changes).
Satellite Systems
Learn more about the Sattelite Systems view
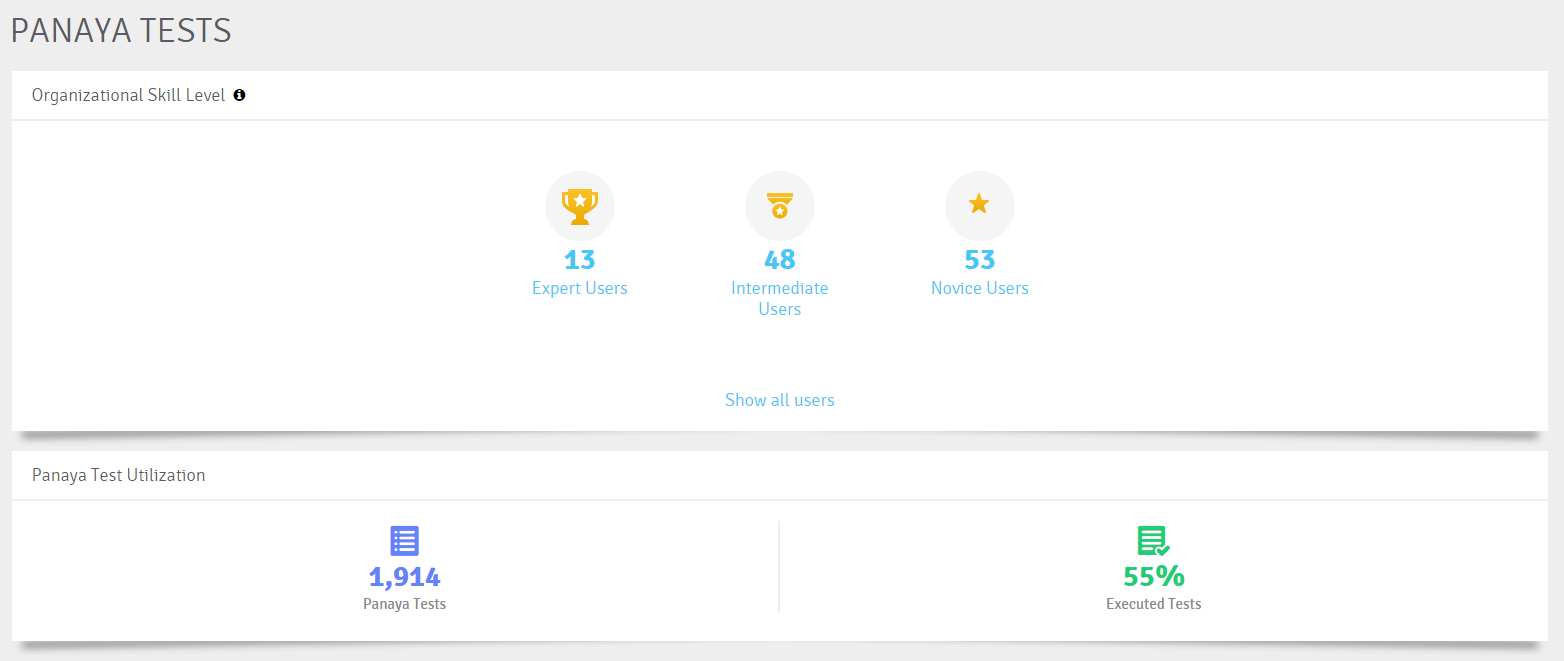
Test Assets
Do you have a new project? Do you know who is already trained to use Panaya and can help you ramp up other users? Do you need a Panaya champion for your projects?
Panaya Test Assets will show you:
Who are the top Panaya users in your organization, ranked by the number of tests they run across projects
The number of tests created in Panaya and their level of utilization
The transactions/objects which are already covered by tests
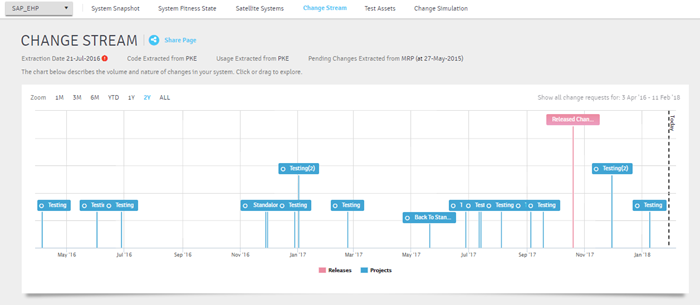
Change Stream
The Change Stream displays a timeline-based view of all system changes, nature, and volume. In addition, it provides meaningful insights for upcoming changes and the ability to leverage Panaya’s services.