The Org Overview dashboard provides valuable insights into your Production Org (based on these setup criteria).
The dashboard visualizes key metrics & insights that allow you to make educated decisions about improving Org maintenance and health based on Panaya and Salesforce best practices.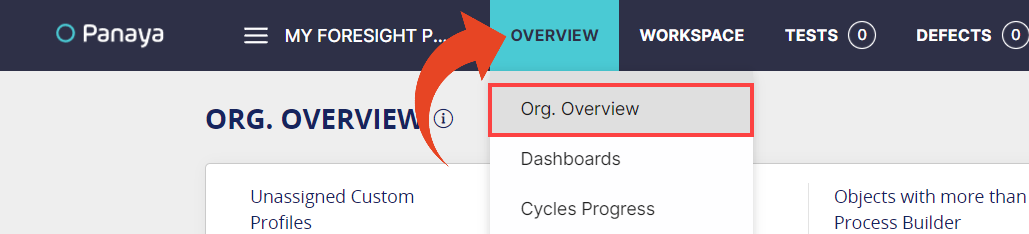
The dashboard serves as a ‘health check’ for the Org to help you understand how to align with the recommended best practices for Salesforce excellence.
The available widgets include insights about Org Size, Org Complexity, Distribution of Component Types, Code vs. Declarative, Custom Profiles, Permission Sets, Process Builders, and more.
To enable this feature for your account, contact Panaya Support
Where is the Metadata Extracted From?
- The Org Overview Dashboard will be based on Production Org metadata only when both the Production Organization is authenticated to the Production Org and it is configured to retrieve components maintained in the production.
- If the Production Organization is authenticated but the checkbox for Components maintained in Production is unchecked, the Org Overview will not display.
- If the Production Organization has no authentication setup, the Dashboard will use the metadata from the (Sandbox) org authenticated in the Sandbox Organization.
All the widgets in the Dashboard will use metadata extracted from your Production Organization org when the first criteria described above is met. Otherwise, all the widgets will be based on metadata from the Sandbox Organization org. The ‘Org. Complexity’ widget will always use metadata extracted from the Sandbox Organization org.
The metadata extraction is based on the extraction schedule set for the account, and the Dashboard is refreshed after every scheduled extract.
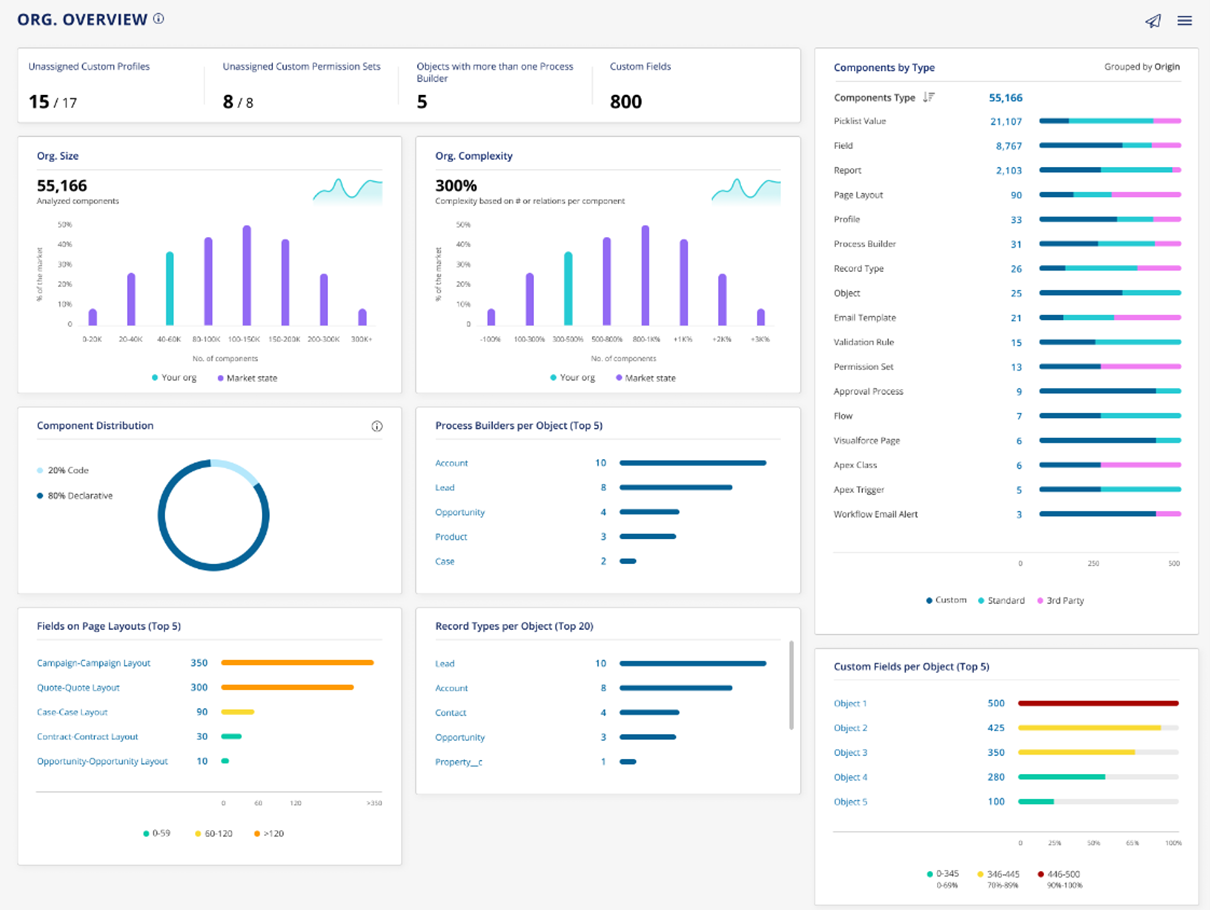
Available Widgets
The insights included in the dashboard are:
Highlights
This section displays highlights of several key insights.

Unassigned Custom Profiles
Displays the number of custom profiles that are unassigned out of the total number of custom Profiles. You can drill down to see the details of the profiles to take relevant action. Note: If a custom Profile is only assigned to inactive users, it is considered unassigned.
Unassigned Custom Permission Sets
Displays the number of custom Permission sets that do not have active users assigned to them out of the total number of custom Permission Sets. You can drill down to see the details of the Permission sets to take relevant action. Note: If a Permission Set is only assigned to inactive users, it is considered unassigned.
Objects with more than one Process Builder
A Process Builder is a tool in Salesforce that allows Salesforce teams to automate simple processes. Each Process Builder is initiated for/by a specific Object (ex: Account, Lead, Contact), and it is common best practice to have no more than one Process Builder per Object. This insight will show the number of Objects that are ‘initiators’ of more than one Process Builder. You can see the detail in the Process Builder per Object widget described below. Note: This widget refers only to active Process Builders, not inactive Process Builders.
Custom Fields
Displays the total number of custom Fields across the entire Org (i.e., across Objects such as Leads, Accounts, etc.). Having many custom Fields can negatively affect the performance of an Org.
Potential Technical Debt Components
Click on the displayed number to identify Fields that that are potentially serving as technical debt within your Org. We’ve identified several indicators of potential technical debt, such as Fields with names that hint deprecation (i.e., Field includes ‘old’ / ’temp’ in the name), Fields not used in any Page Layout or key components, and more.
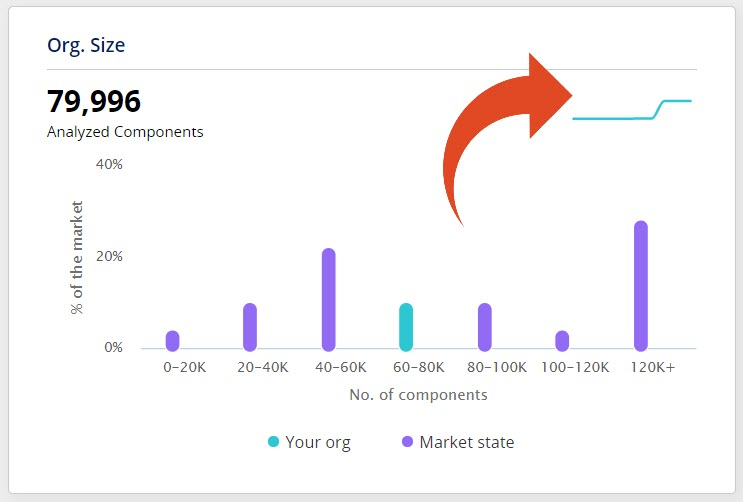
Org. Size
This widget displays the total number of analyzed components within the Org. The bar chart shows where you are compared to the market.
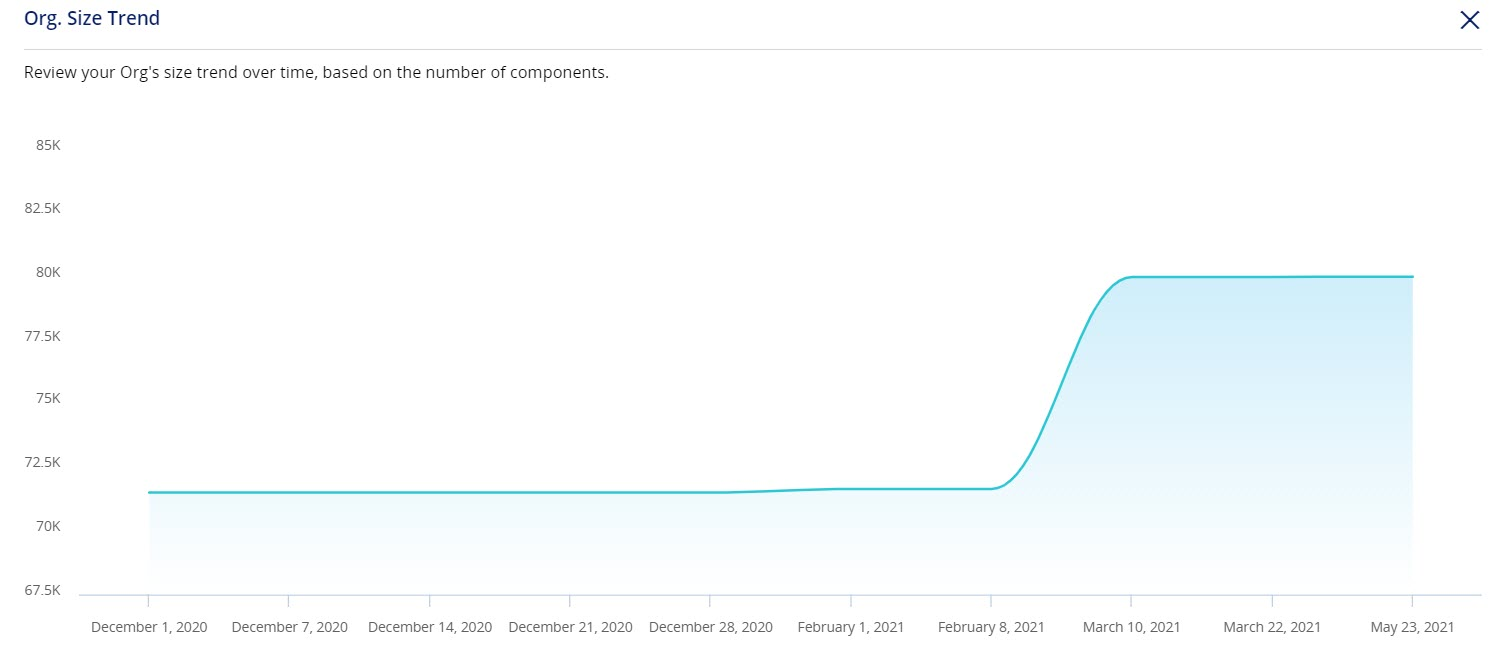
Click on the trend graph to see the changes in your Org Size over time.
Org. Complexity
This widget reveals insights into the complexity of the Org. Complexity is calculated as the ratio between the number of analyzed relations/inter-dependencies divided by the total number of analyzed components. The bar chart displays where you are compared to the market.
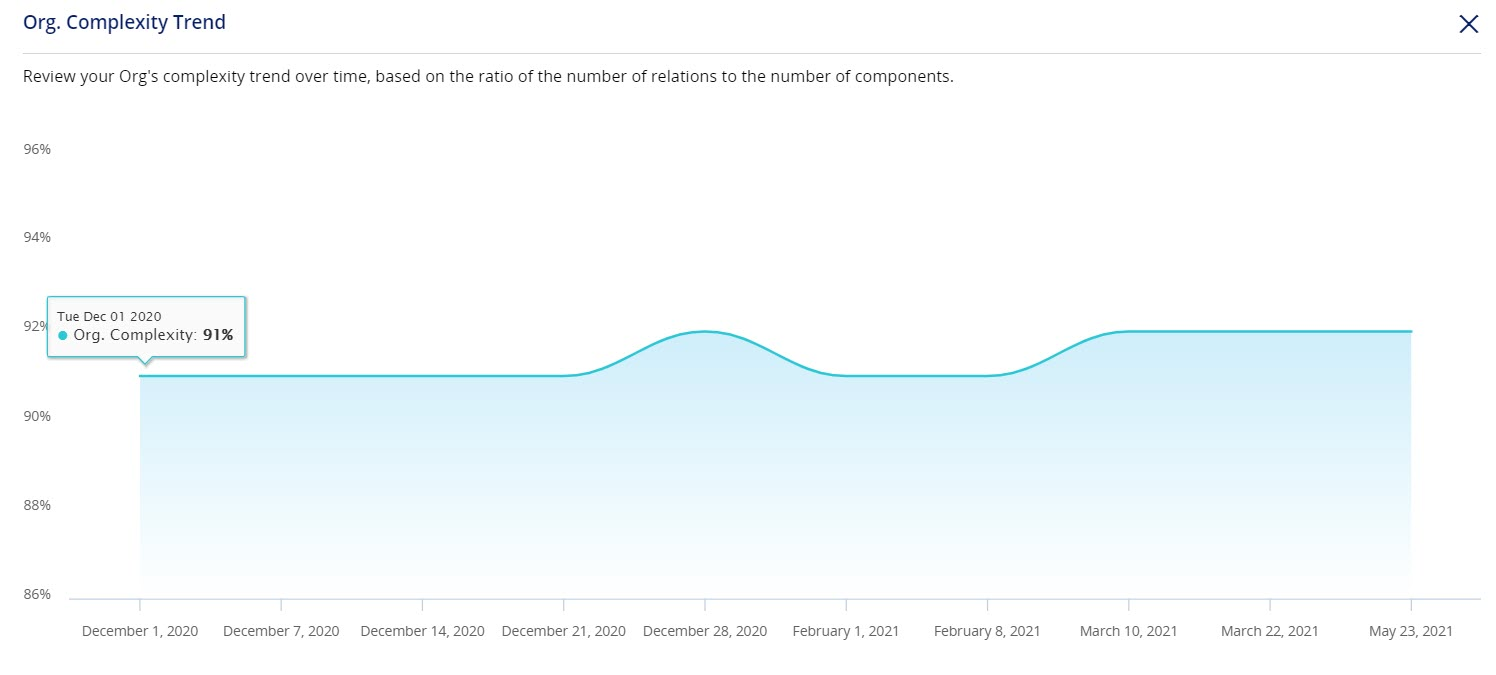
Click on the trend graph to see the changes in your Org Complexity over time.
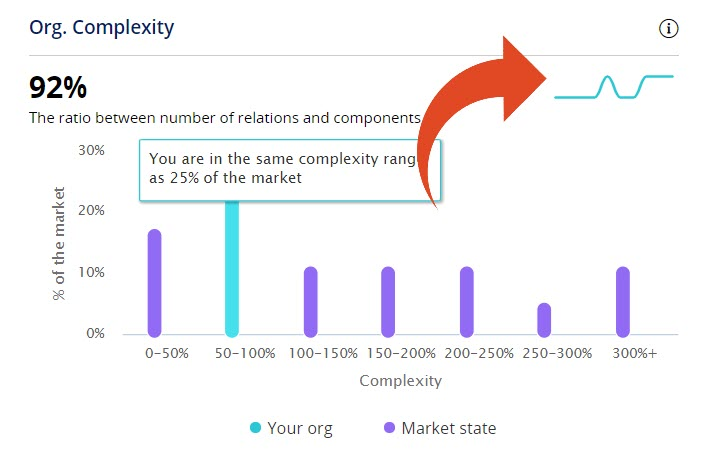
This widget is always based on metadata extracted from your Sandbox Organization org, and never from the Production Organization org.
Components by Type
This widget displays the distribution of components by type and grouped by “Origin” - whether the components are Standard Salesforce, Custom, or 3rd Party -
- Standard = Standard Objects by Salesforce
- Custom = Custom Objects, built by you within the analyzed Org
- 3rd Party = Refers to 3rd Party apps, including packages offered in the Salesforce AppExchange
You can sort by Name (A-Z) or by Number (High to Low), as shown below.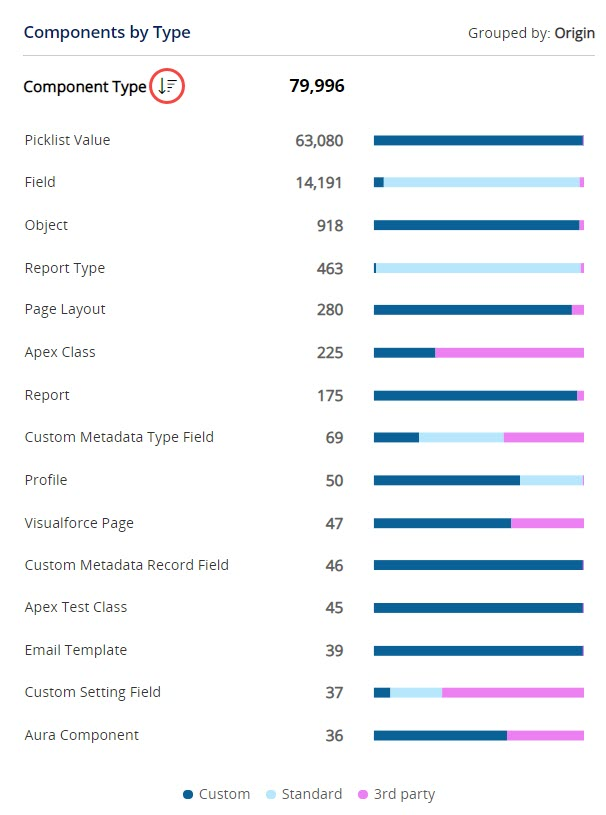
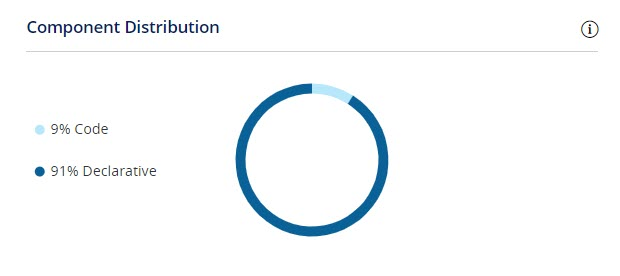
Component Distribution
This widget displays the distribution between Code-based components (Apex classes, Visualforce Pages, etc.) and Declarative components (‘Point and Click’). Note: Fields, Picklist Values, and all 3rd Party components are excluded from this calculation to over-balance the distribution.
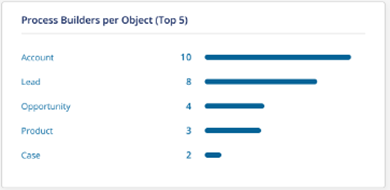
Process Builders per Object
This widget displays the Top 5 Objects with the highest number of Process Builders. It is a detail of the Highlight of Objects with more than one Process Builder described above.
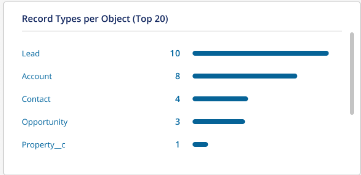
Record Types per Object
This widget displays the Top 20 Objects with the highest number of associated Record Types. Unused Record Types make your Salesforce implementation challenging to maintain. It is recommended to review the Record Types and delete those no longer needed.
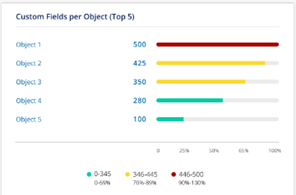
Custom Fields per Object
This widget displays the Top 5 Objects with the highest number of associated Custom Fields. The bars are color-coded according to the available limit of Custom Fields per Object, based on your Salesforce edition.
Fields on Page Layouts
This widget displays the Top 5 Page Layouts with the highest number of associated Fields. The bars are color-coded according to the ranges that are recommended as a best practice. Having too many Fields can lead to cluttered Page Layouts, additional maintenance, and a possible negative impact on page performance.
