The run details view displays execution status, evidence, failure analysis, and execution metadata.
Show Run Details
There are multiple ways to display run details in Panaya.
From an Automated Test Planned Run
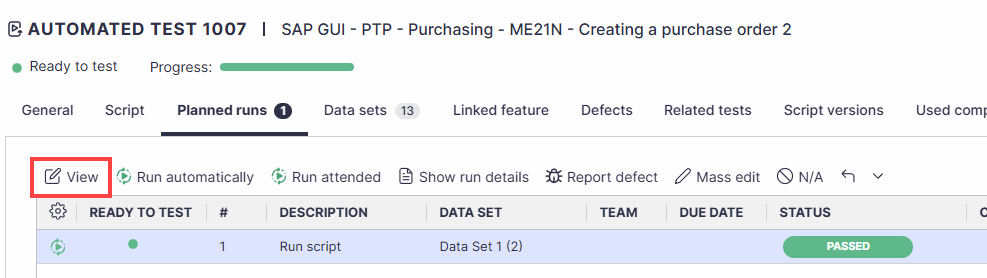
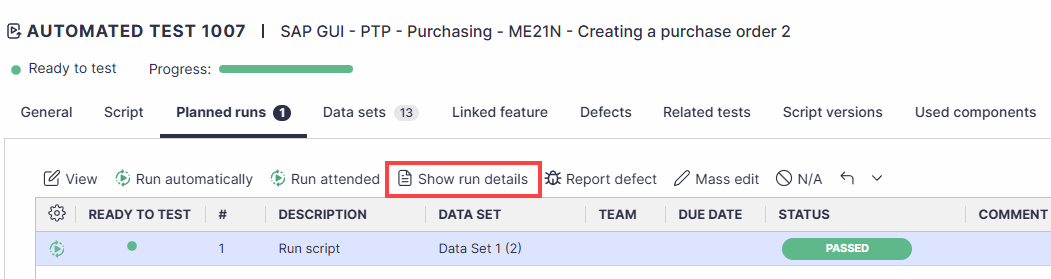
In your automated test, select the Planned runs tab.
Highlight the relevant planned run, then click Show run details.
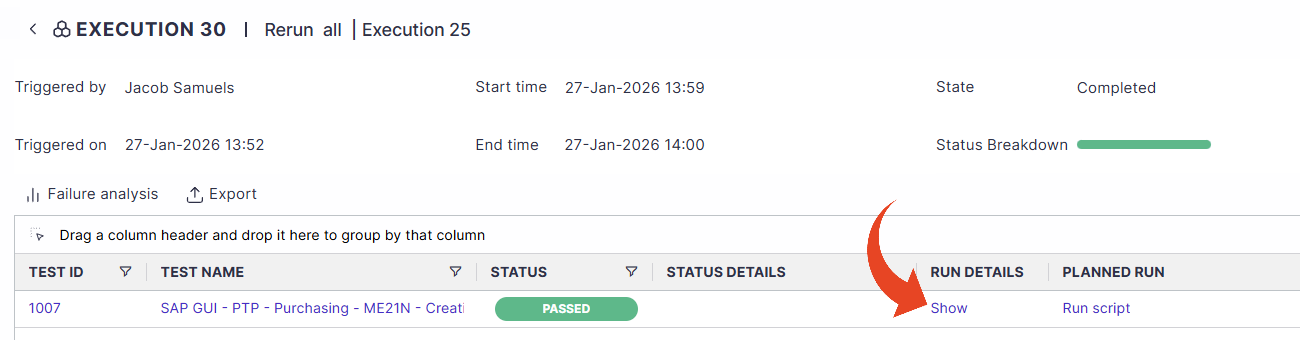
From Automation Executions
To view the run details when reviewing automation executions -
Click on an execution.
Click on the Show button in the Run Details column to drill down to the evidence and execution metadata.
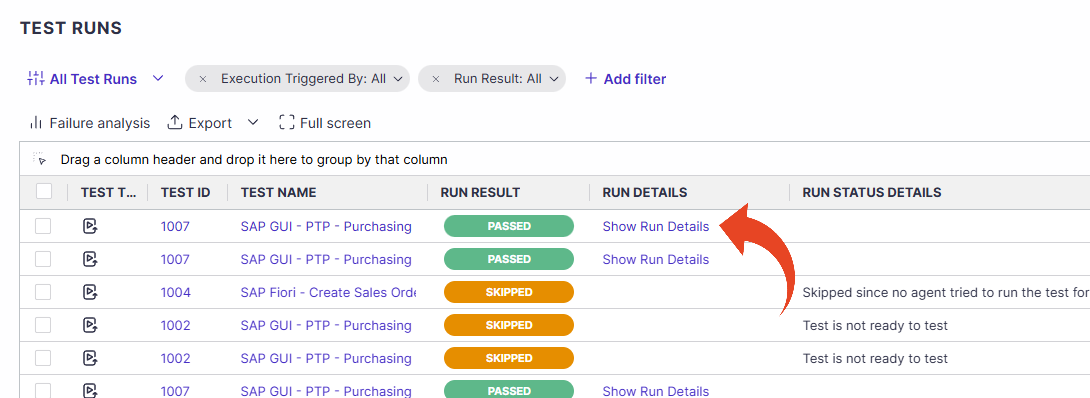
From Automation Test Runs
To view the run details when reviewing automation test runs, click on the Show Run Details button in the Run Details column.
See also
Run Details Tabs & Options

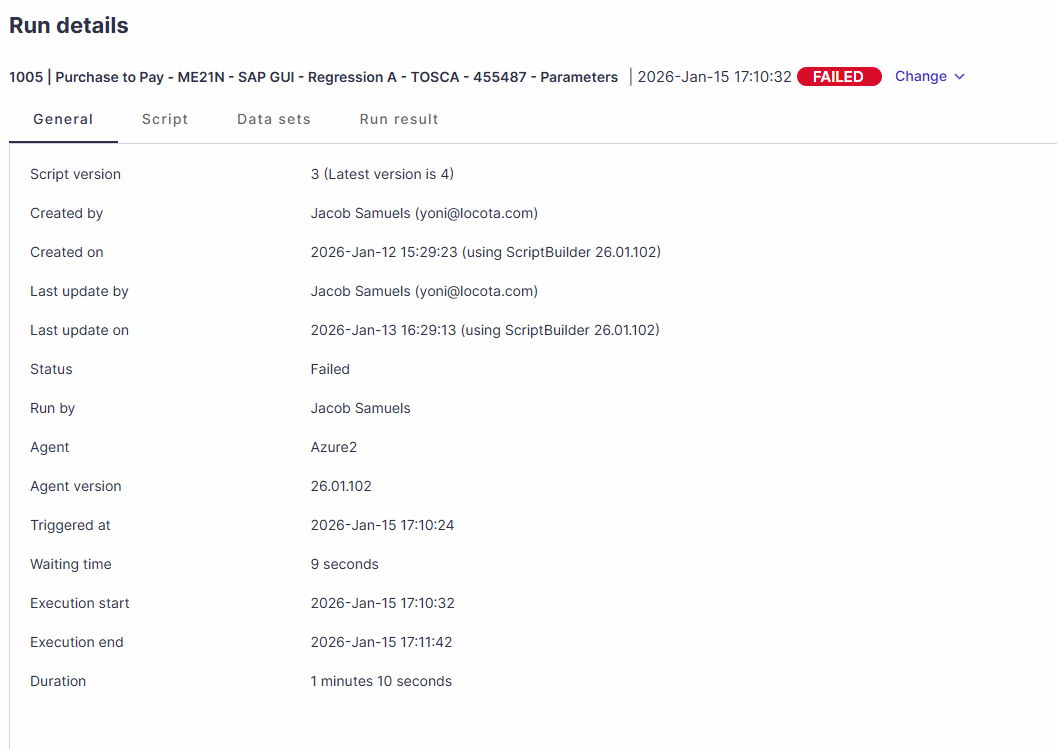
General
The general tab includes metadata about the run.
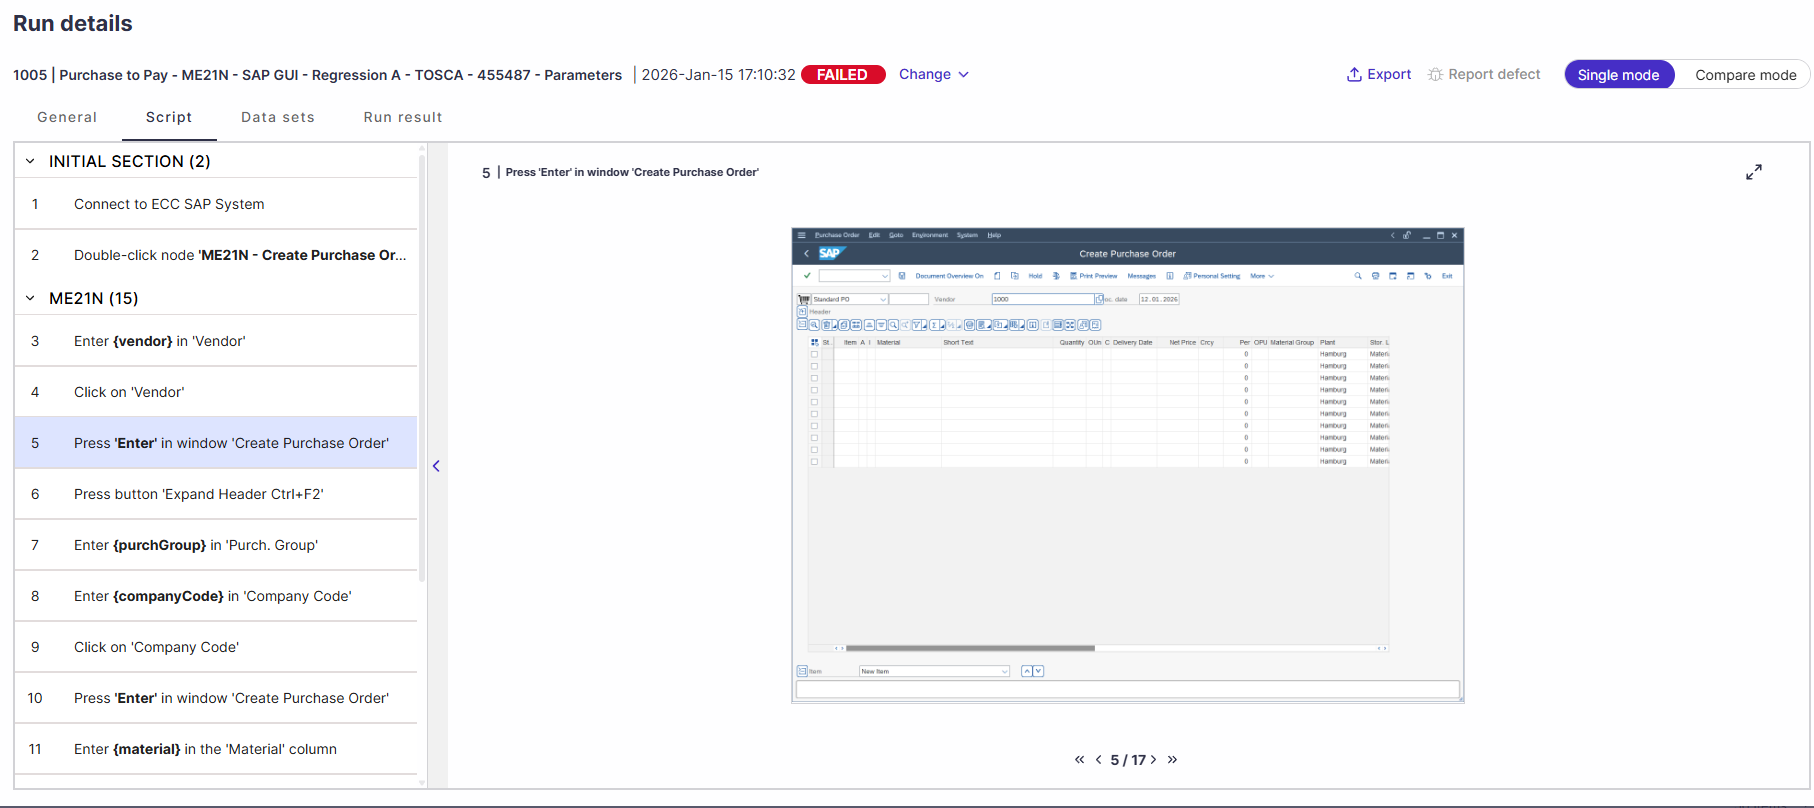
Script
The script tab displays the original script recording screenshots as they were captured with ScriptBuilder.
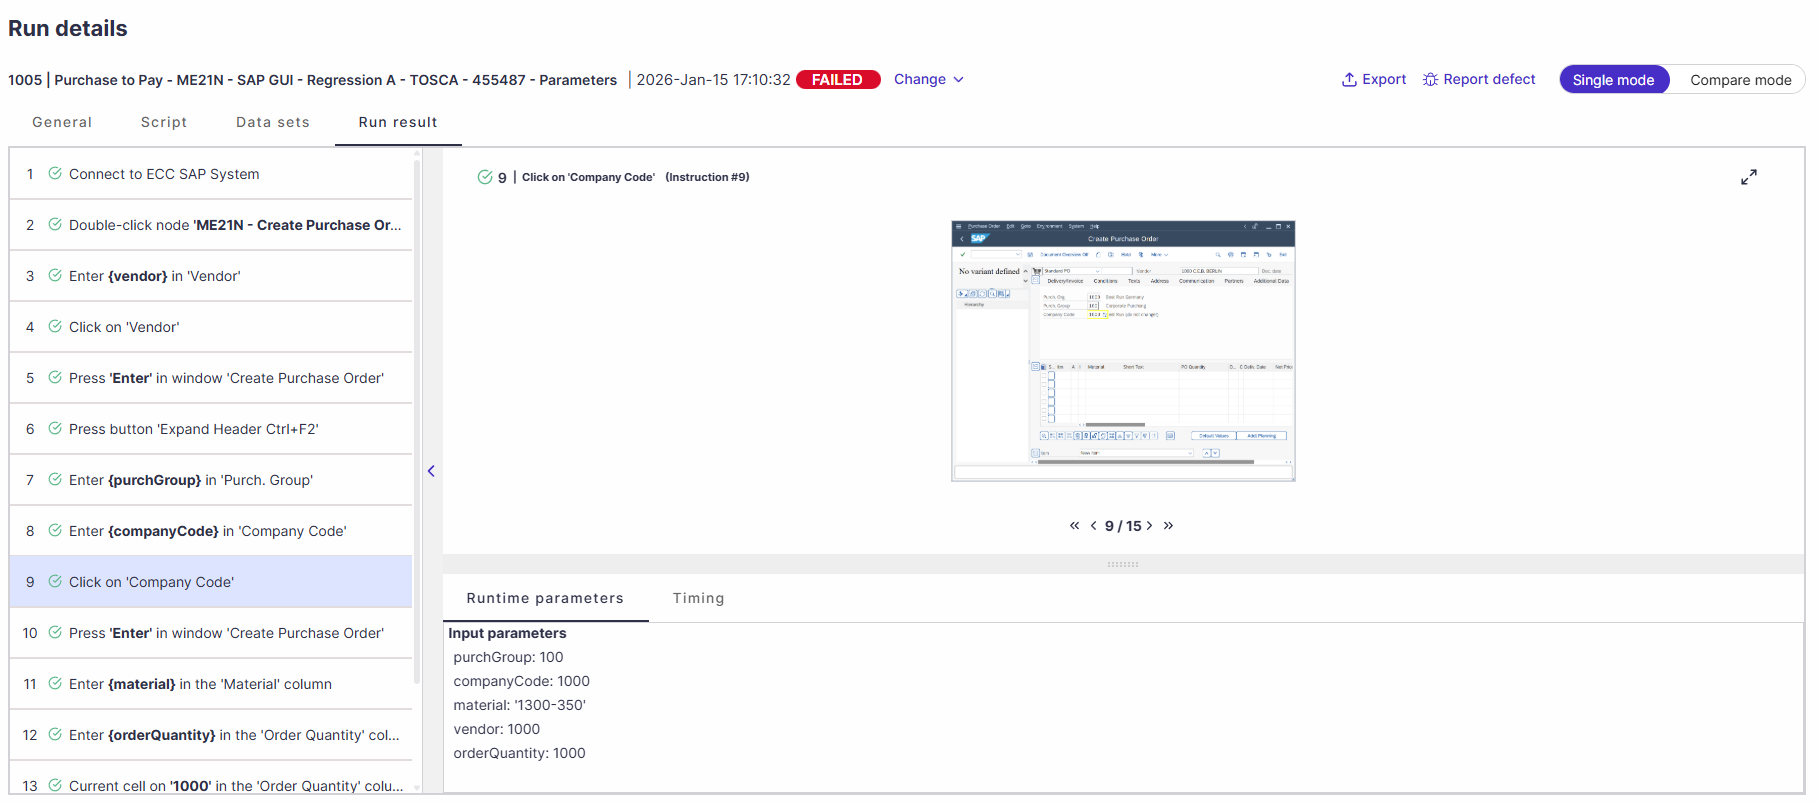
Run Results
Select Run Results to view all instructions and their statuses.
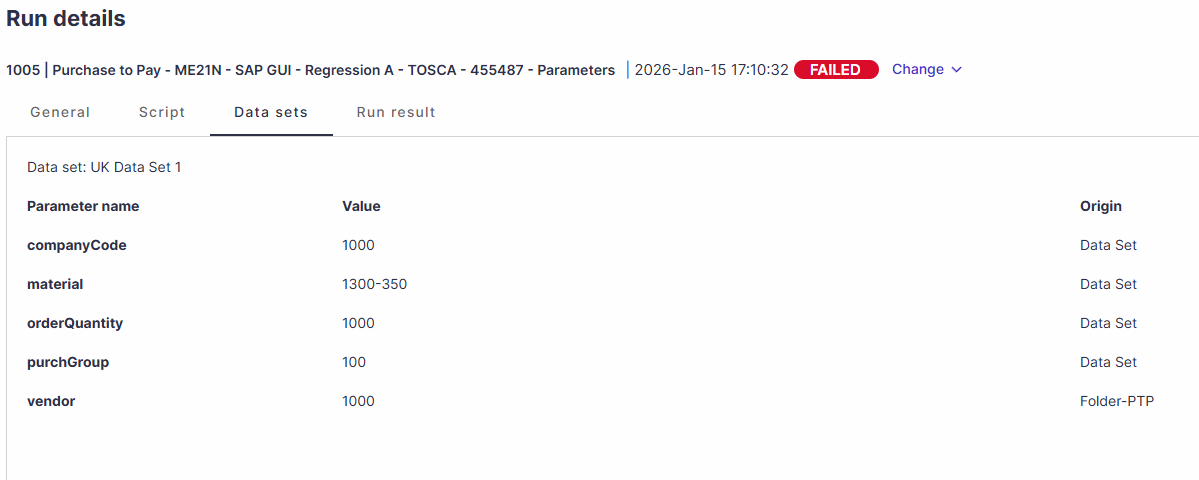
Data Sets
The Data Sets tab in the run details view displays the data set used, the parameters, values, and their origin - Data set or global parameter data.
Compare mode
You can use compare mode to compare screenshots and instructions from two views, such as a passed vs. a failed run or the last run.
This option works well when you need to analyze and compare a run with a previous one.
Learn more about automation runs compare mode

Report Defect
You can report a defect directly from the Run Results view by clicking the Report defect button. The newly created defect will automatically include a screenshot of the relevant instruction. In addition, the “Steps to Reproduce” tab in the defect will display all instructions leading up to the relevant step.

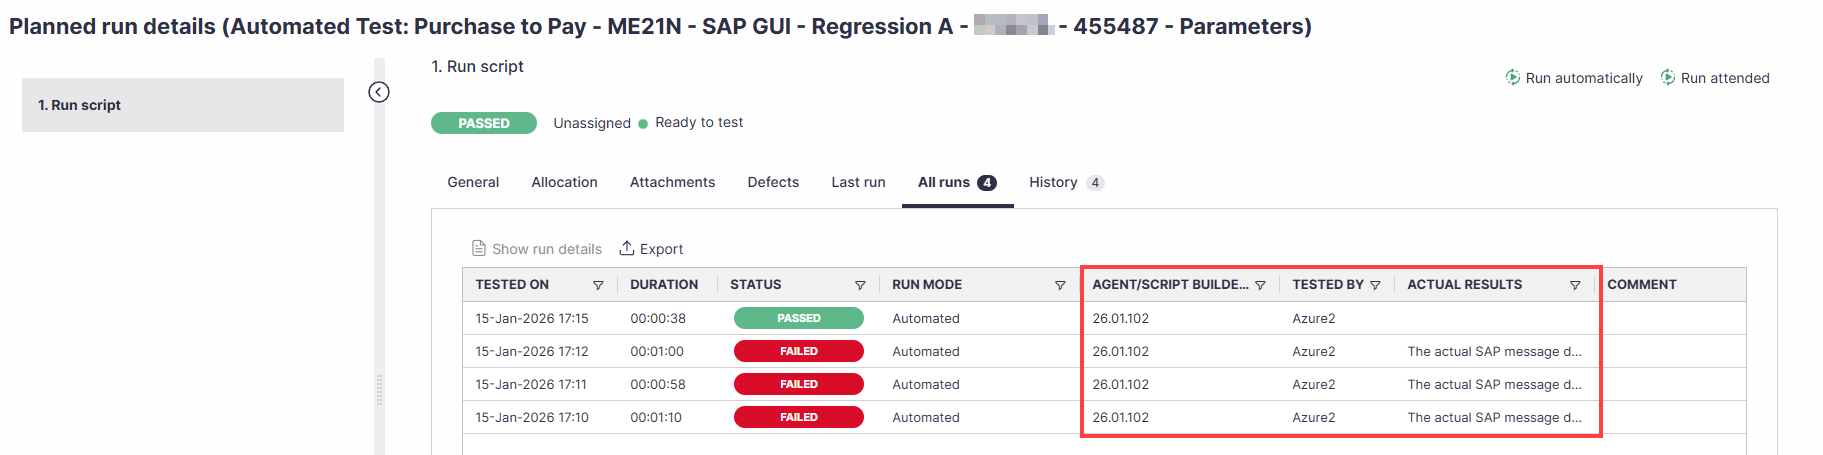
Planned Runs Metadata
You can highlight a planned run, then click on View > All Runs to review the failure reason, Agent name, and Agent version (or ScriptBuilder version for Attended runs).
The failure reason appears in the Actual results column.