The Automation Executions list allows you to review all execution events in your project.
An execution event can be an on-demand automation run request or a scheduled test set.
To view the Automation Executions, hover over the Tests tab and select Executions.


Note
Attended Runs do not appear in the Automation Executions view.
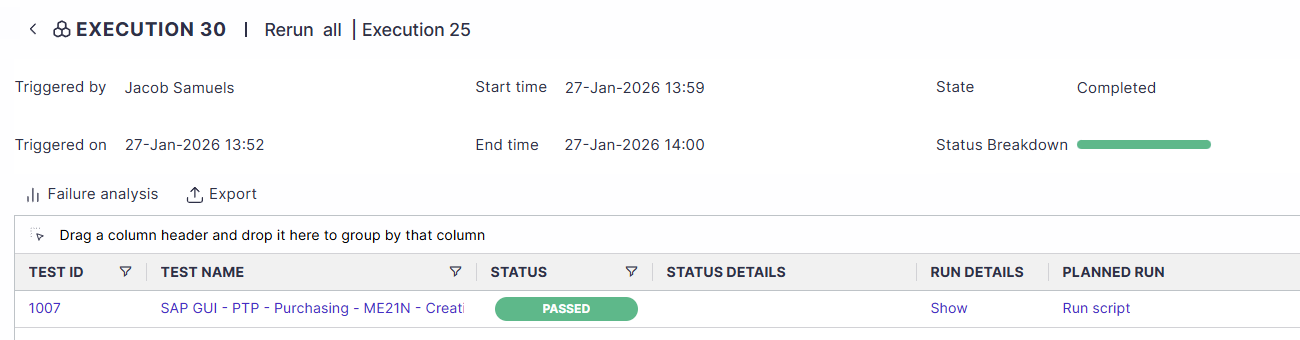
Execution Details
To review the executed planned runs for each listed execution, click on the execution ID.
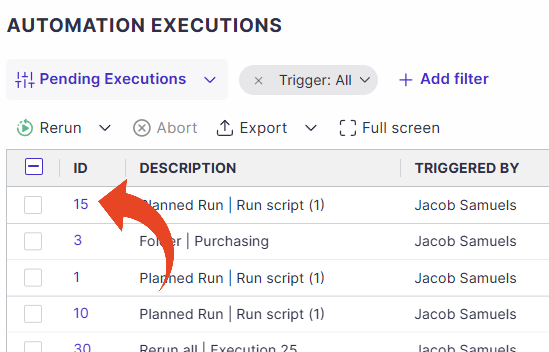
Panaya displays all planned runs, including their status, used dataset, and evidence.
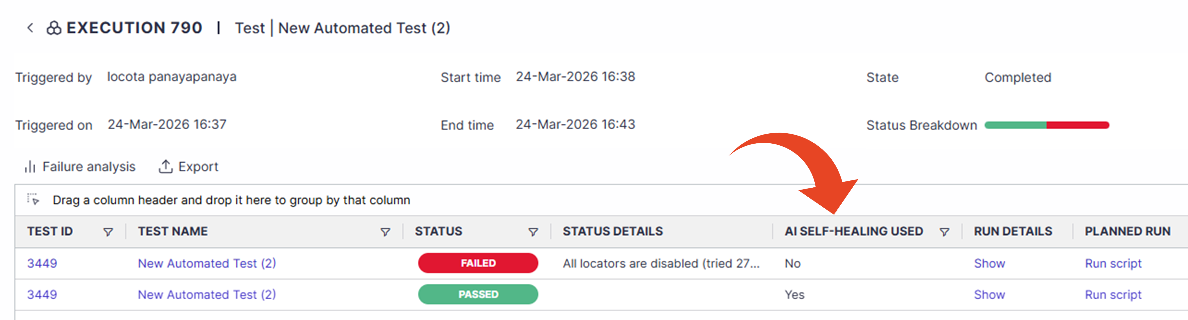
AI Self-Healing Visibility
Test runs with instructions successfully utilizing AI self-healing are indicated in the execution details.
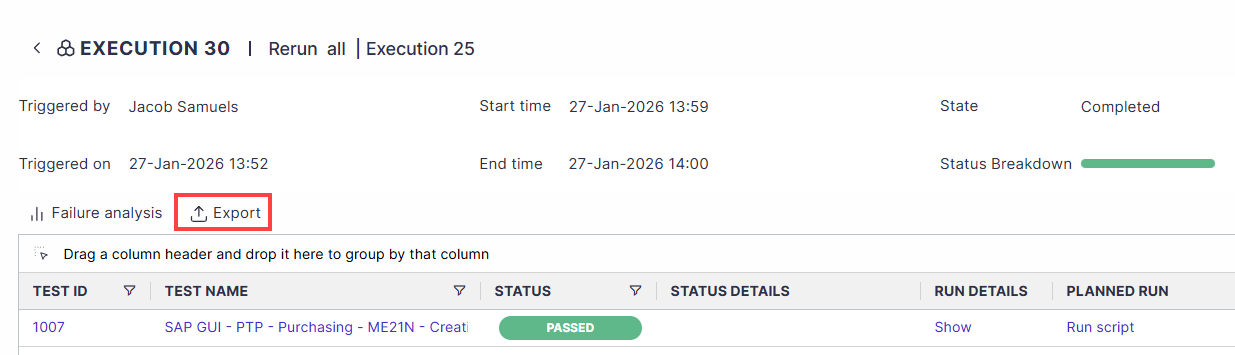
Execution Details Export
The Execution Details can be exported, simplifying troubleshooting, audits, and support workflows.
Click on the Export button to export the execution details.
Good to Know!
You can export automation run evidence for specific planned runs.
Run Details
Click on the Show button in the Run Details column to drill down to the evidence and execution metadata.
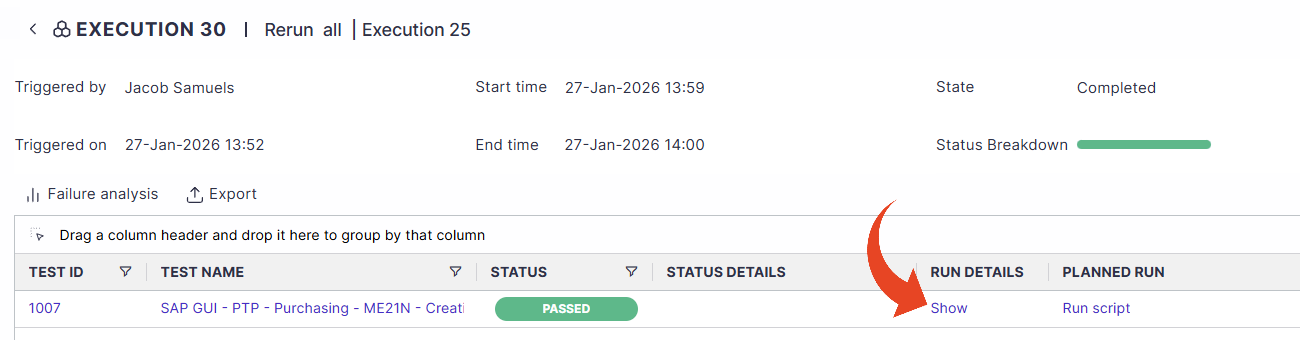
Click here to learn more about the automation run details and evidence.
Planning Report
Use the Select Column button to add the planning report to the automation executions list.
The planning report provides more details about each execution, such as the number of runs planned, created, and executed, and the number of tests or planned runs skipped.


Adding or removing columns
Add or remove columns from the list using the Select Columns button.

Filters
You can add filters to filter the list by the execution state, total runs, and any other applicable field values.

Rerun Executions
You can select one or more executions from the list and rerun them.
Select Rerun All to rerun all the selected executions regardless of their run result, or select Rerun failed runs to rerun executions that have previously failed.
Good to Know!
For executed planned runs using the “All” data sets option, selecting rerun will execute only the failed data sets.

Abort Executions
You select to abort executions that are in progress. To abort, select the executions from the list and click on Abort.

Note
When you select an execution and click Abort, all "Not Run" scripts within that execution are immediately cancelled. However, any run/script currently in progress will continue to execute until the agent reports a final status or the system's timeout mechanism automatically aborts it—typically occurring if no status is reported for more than 24 hours. When the system's timeout mechanism is triggered, the execution state transitions from "In Progress" to "Aborted" or "Skipped."