The Stacked Columns widget displays a comparison of numeric values between levels of a categorical variable. The chart shows data series stacked one on top of the other in vertical columns. The widget works for Tests, Steps, Defects, Automation Runs, Requirements, and Features.
For example, you can visually compare the defect volume per owner and their current statuses.
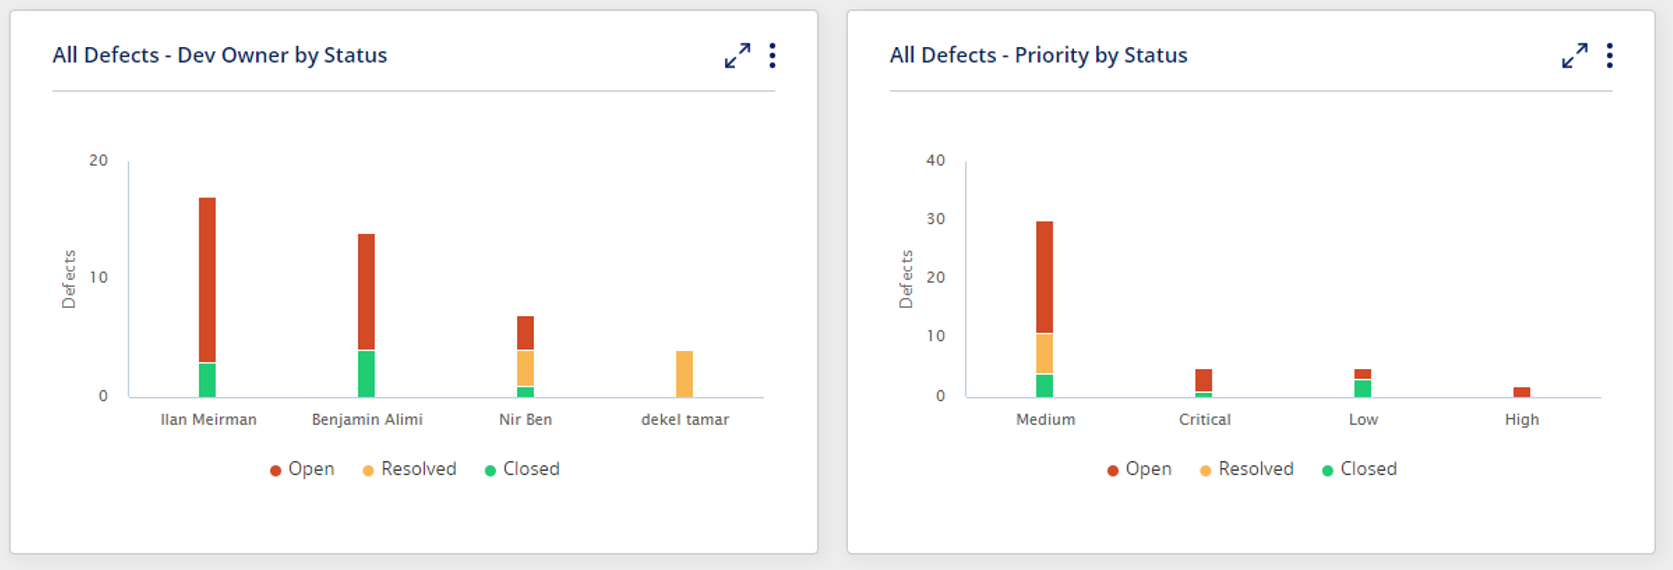
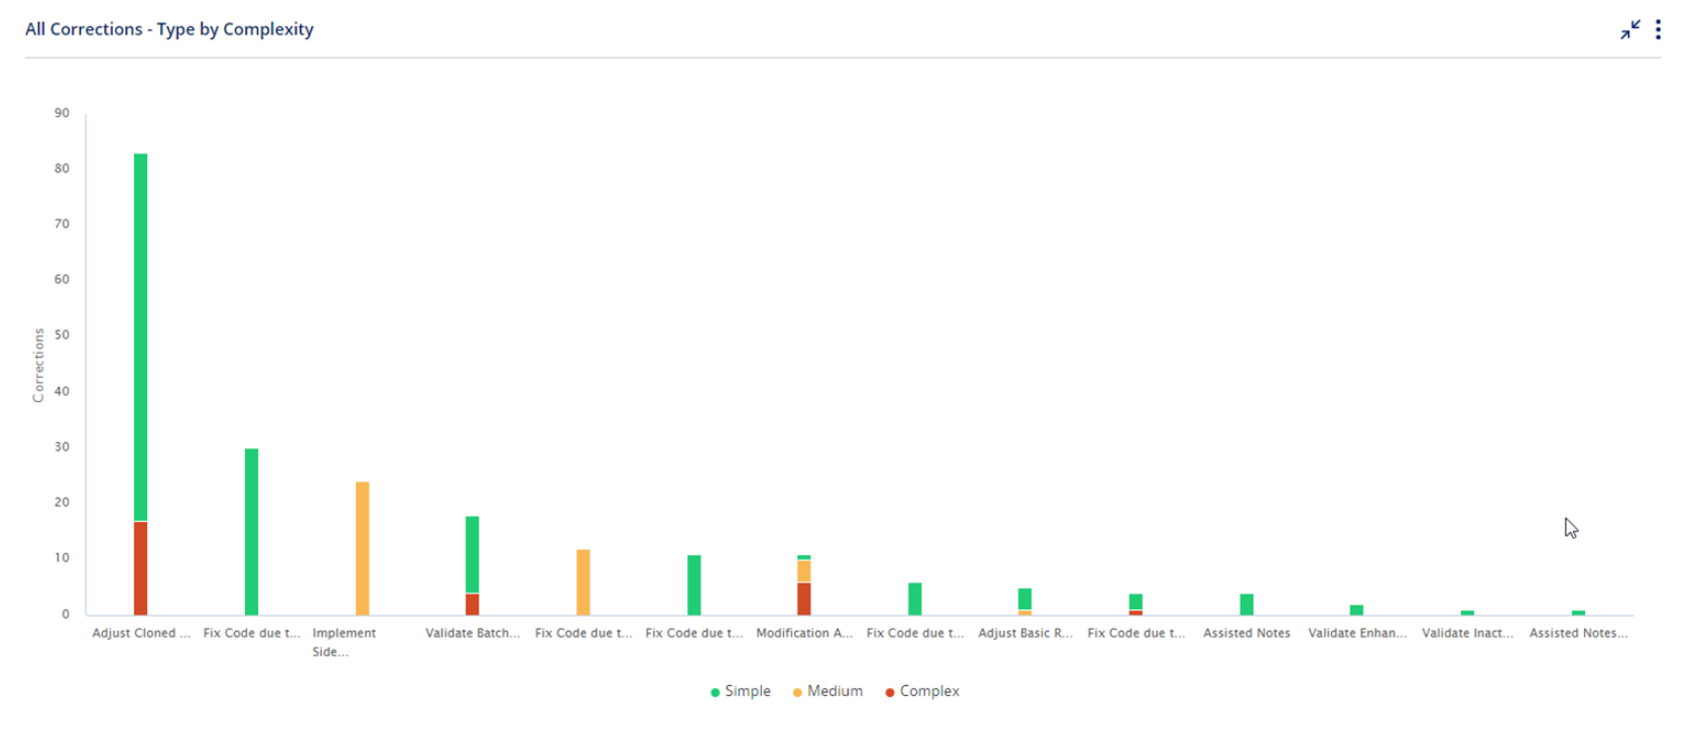
You can hover with the mouse to view actual numeric values.
Users can click on specific parts in the chart to drill down to the list of activities.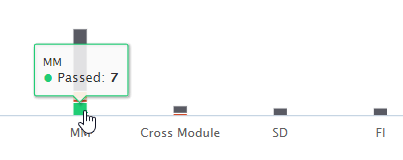
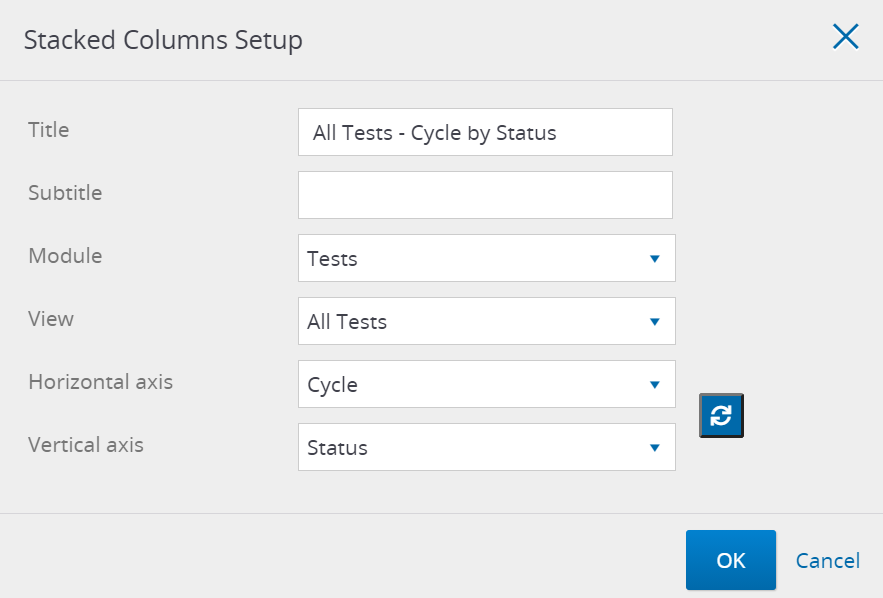
Widget Setup
Click on
 and then select Edit
Here is what you can define in the Widget setup -
Title
Sub Title
Module - Tests, Steps, Defects, Corrections, Requirements / Development, and Automation Runs.
Select the Module first to populate the available Views.View - you can select from predefined views for Tests, Defects, Corrections, Requirements / Development, and Automation Runs.
And you can also select one of your customized filtered viewsHorizontal axis - Select the field to use as the horizontal axis. The chart bars will be separated by the values of this field. For Automation Runs, the supported fields are AI fallback used, run results, test type, and execution trigger.
Vertical axis - Select the field to use as the vertical axis. Each chart bar will be split by the values for this field.
Good to Know!
For Automation Runs, the supported axis fields are AI fallback used, run results, test type, and execution trigger.
Tip
You can always quickly switch between axes with the Switch button 
Good to Know!
The widget supports up to 100K displayed tests and steps and up to 10K defects.