The graph allows an immediate understanding of how components are impacting one another.
- Click on any component and highlight its entire impact path
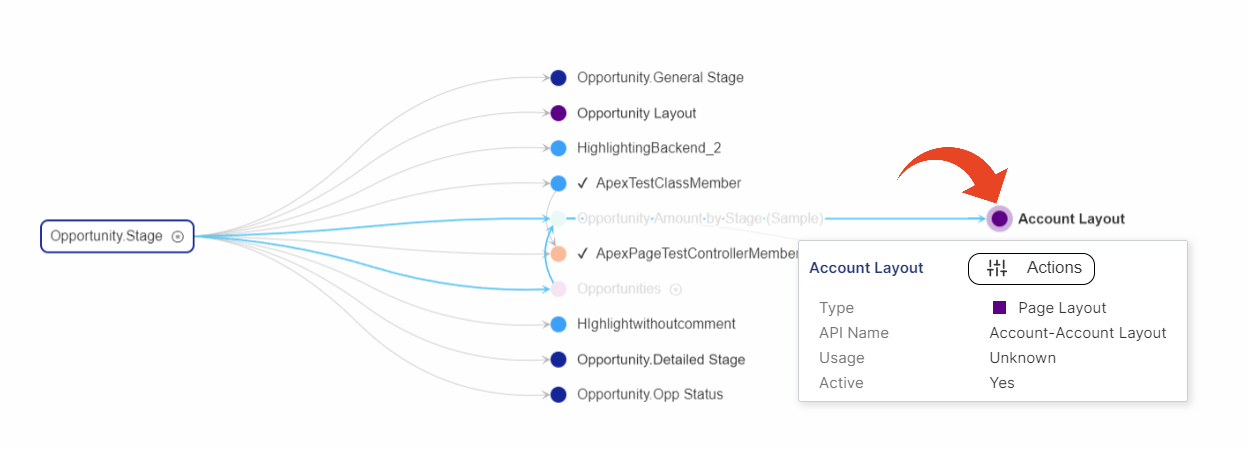
- Color-coding allows differentiating between the various component types.
Click on the component type in the legend to narrow down the graph display.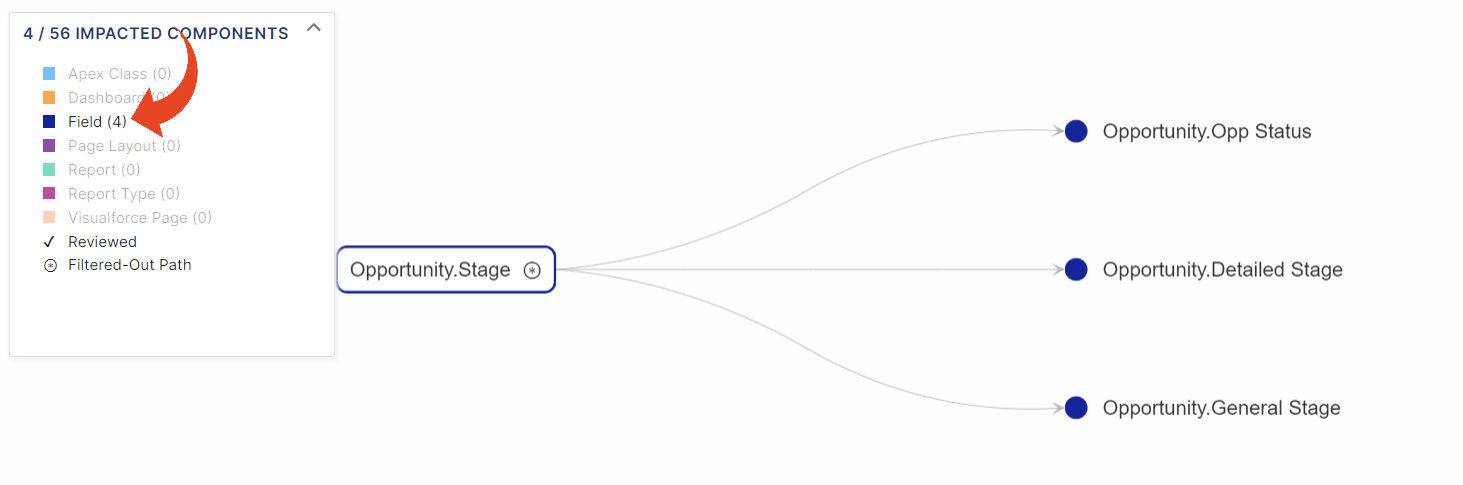
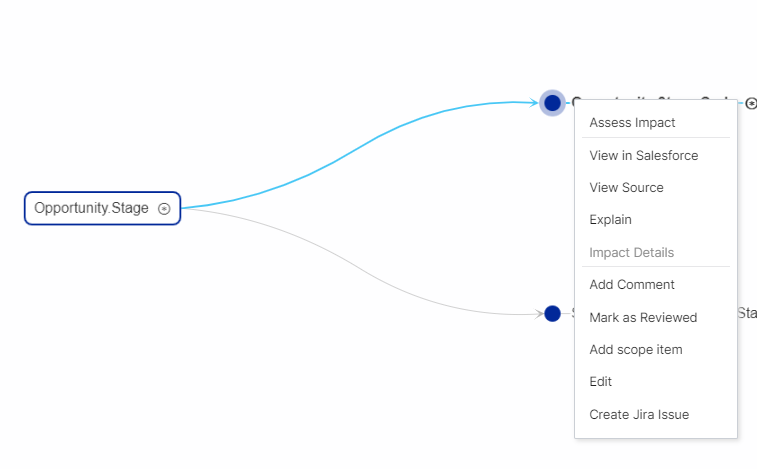
Use the right-click on any component to find different actions that can help you review your analysis -
- Assess Impact - see the Graph view of the selected component and its relationship to the Scope Item and other related dependencies
- View in Salesforce - easy access to view the component in your Salesforce org
- View Source - view the source code of the selected component. The list of components for which View Source Code is available can be found here.
- Explain - see detailed documentation of the component functionality. Supports Apex classes and triggers, formula fields, validation rules, and Flows.
- Impact Details - see the impacted elements and resources for Flows, and impacted steps for Process Builders
- Use filters to narrow down the visual display only to show the items you wish to focus on.
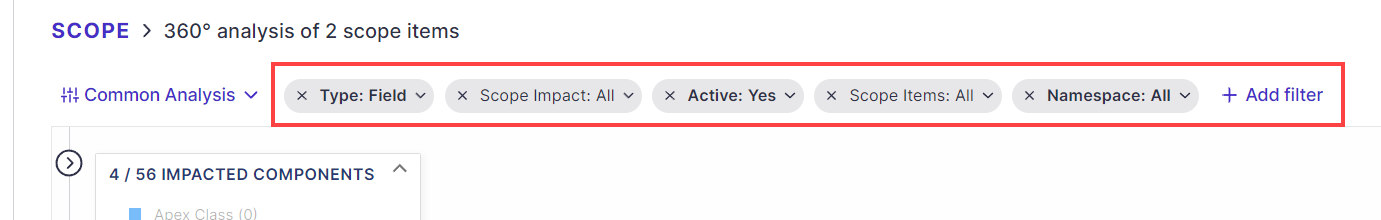
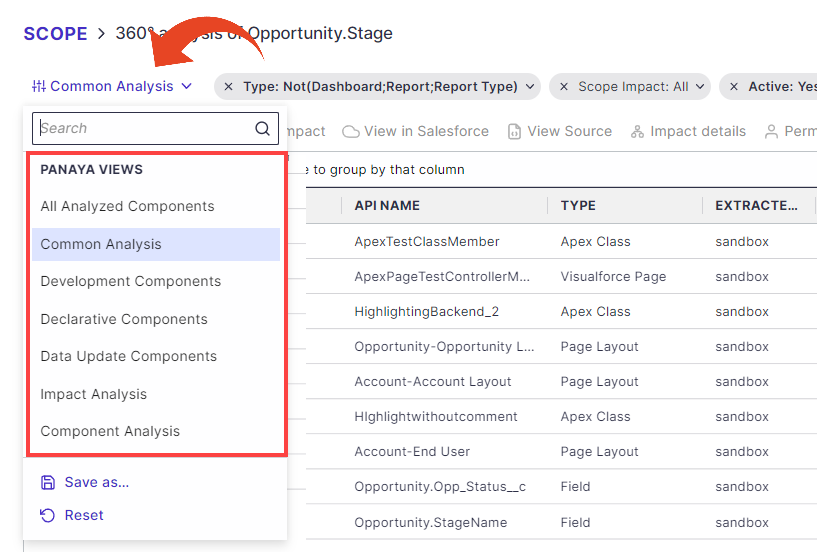
- Or use a predefined view
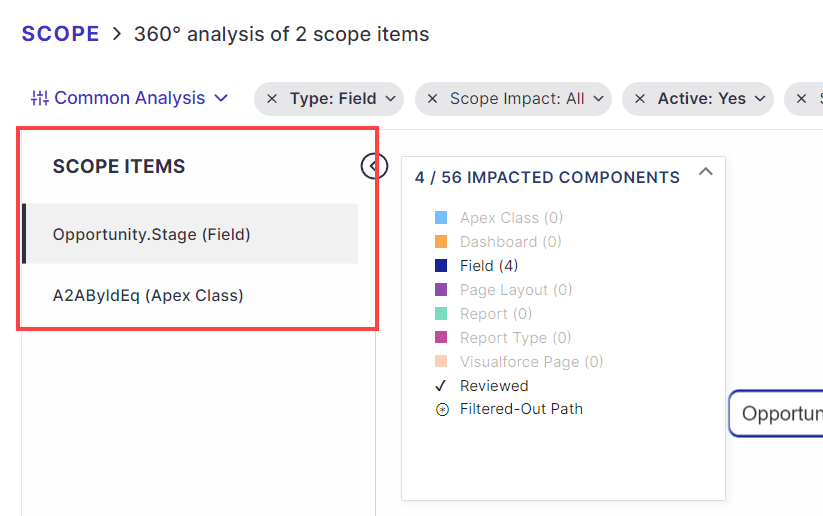
- The left pane allows browsing between associated scoped items
Good to Know!
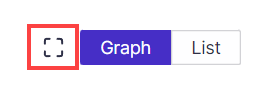
- You can work in full-screen mode to allow maximum space for you to assess the impact.
- There is a limit of 2000 components that can be generated in the graph.