Use the Burndown Chart widget to monitor the development progress across a timeline in your custom dashboard. The chart displays your planned vs. remaining development efforts in hours.
You can toggle between iterations. Planned efforts are based on the selected iteration start date.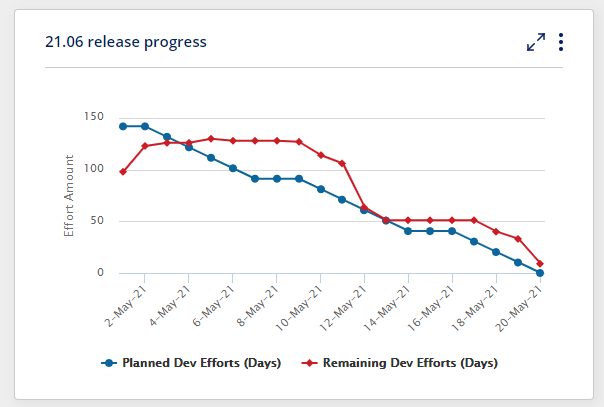
Note
To be able to view the Burndown chart, you will need to populate the Planned and Remaining efforts for your Level 1 activities (typically Requirements or Feature)
This widget is available for Release Dynamix subscriptions