Dashboards
Create and share fully customizable dashboards for your Panaya project activities. Use a variety of new widgets to define the information to display.
Watch this short video to see it in action.
From within a Project -
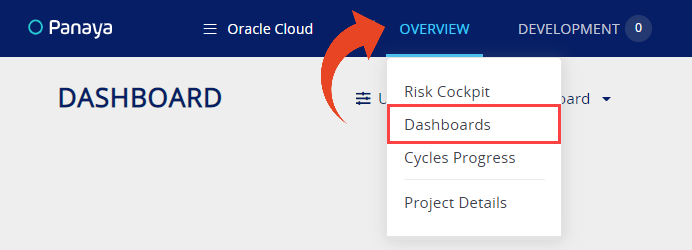
Hover over the Overview tab and select Dashboard
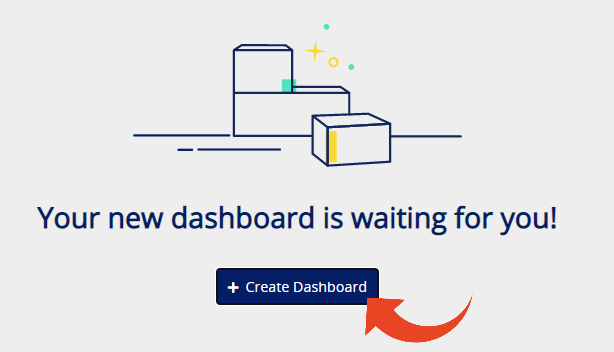
To create a new Dashboard click on Create Dashboard
 OR
OR
Select a Dashboard from the list of existing Dashboards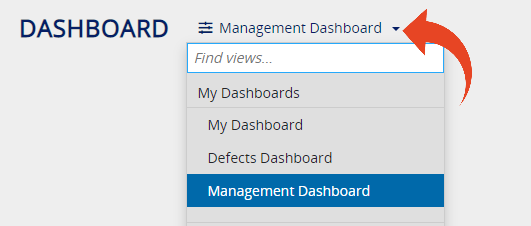
To learn more about our S/4HANA Cockpit Dashboard, click here
Widgets
The Dashboard can include multiple customizable Widgets
What are Widgets?
Widgets are the basic building blocks of a dashboard and display up-to-date data according to their functionality and setup. Use Widgets to display information in an appealing and concise way, like pie charts, big numbers, etc.
Adding Widgets
Click on Add Widget

Select a Widget from the gallery and click on Add. Then click on the Widget to configure.
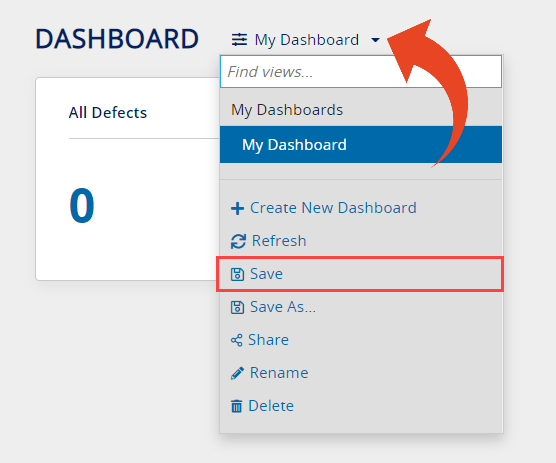
Upon completion, click on the Dashboard name to open up the Dashboards Menu and Save your changes.
Available Widgets
Click here to view all available widgets.
Tip!
Use multiple instances of the same Widget in your dashboard for different purposes.
When configuring a widget, select the data first to automatically generate a widget title.
Dashboards Menu
The Dashboards menu is where you can Share, Rename or Delete your Dashboard along with additional options shown below.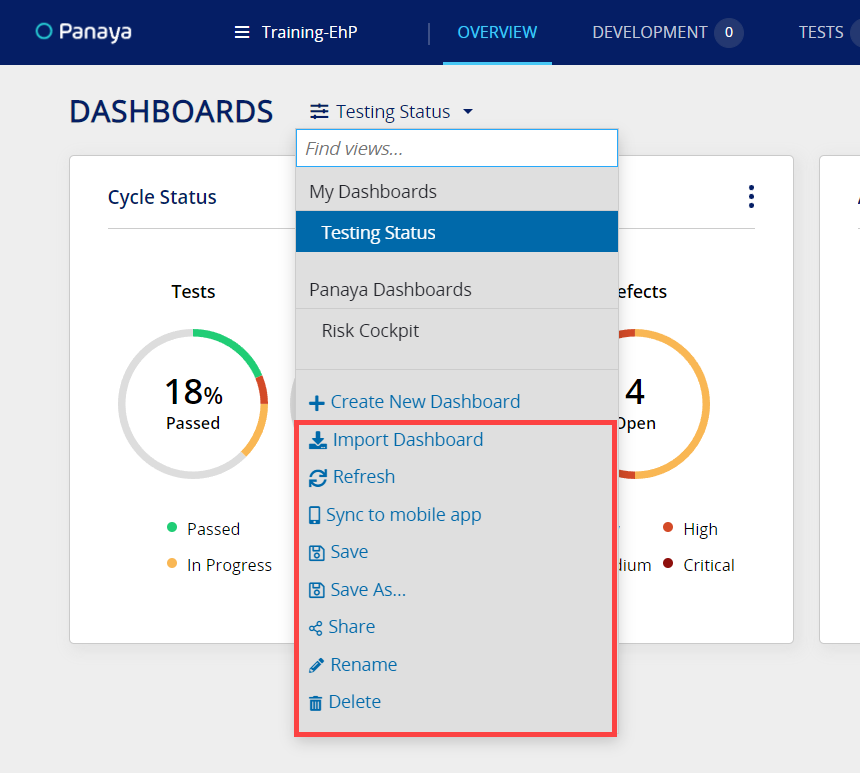
When sharing a Dashboard, you can allow Read-only or Editable permissions. 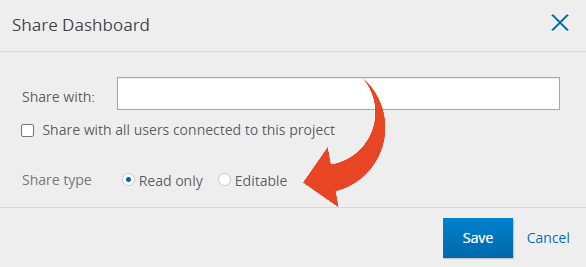
Keep in mind
The order of Dashboard widgets may differ for different viewers, depending on screen resolution.
Import Dashboard
Use the dashboard menu to import dashboards from other Panaya projects.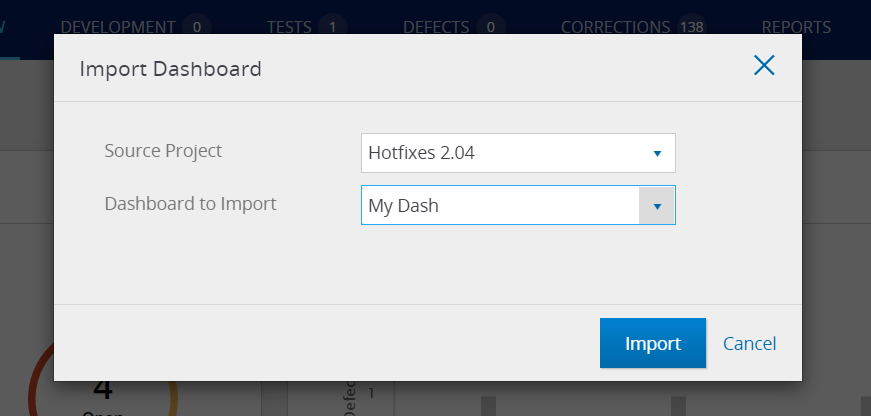
Dashboard Examples
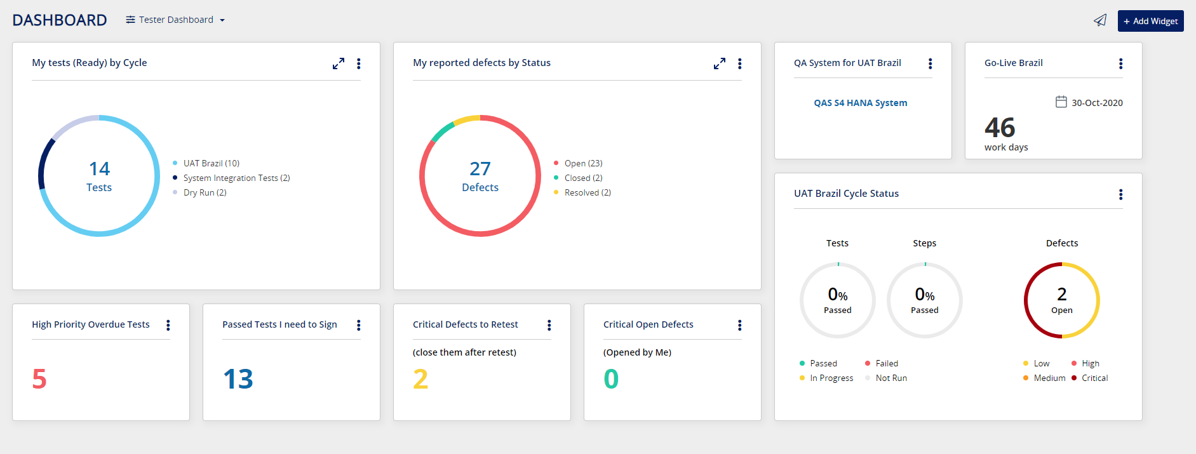
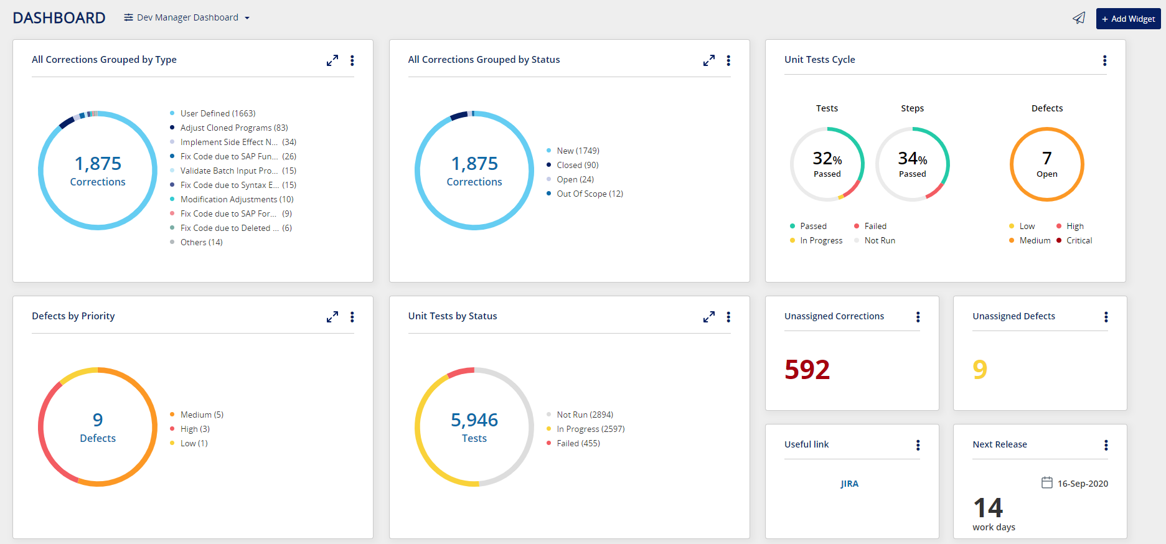
Here are some Dashboard examples by roles (click to enlarge) -
Test Manager Dashboard
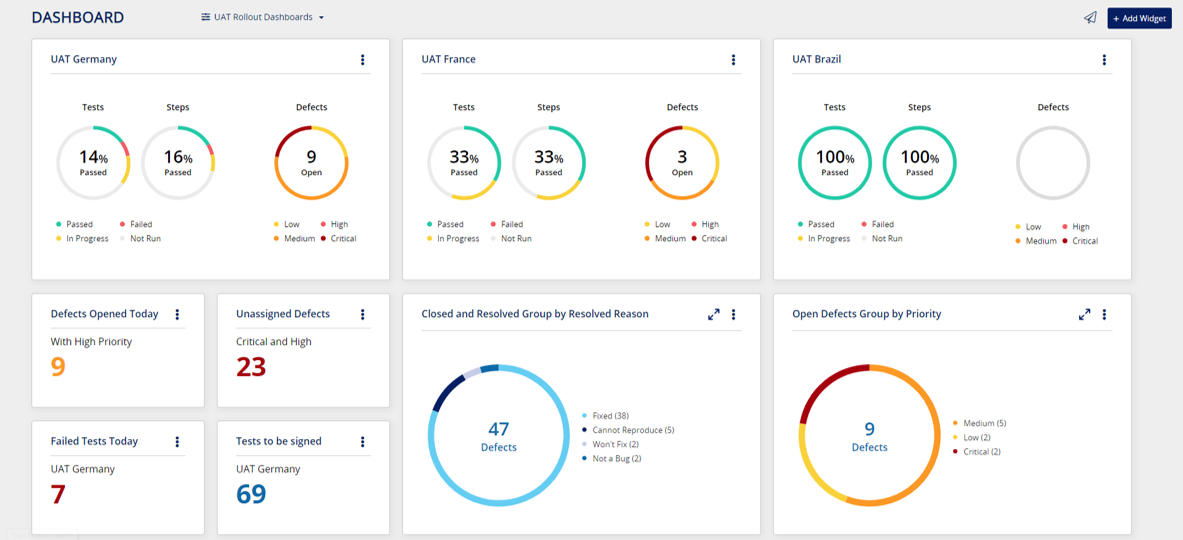
Tester Dashboard
Development manager dashboard
Good to Know!
Dashboards are defined per project
Each project user can create up to 30 Dashboards in a project
A single Dashboard can contain up to 30 Widgets
Widget titles are limited to 50 characters