The Dashboard View allows you to stay on top of Systems and Projects. Here you can view the remaining tasks count and effort alongside other helpful information regarding the status of defects and test results for any of your landscape activities. The information can be easily customized by selecting specific projects or defining the time frame for specific purposes.
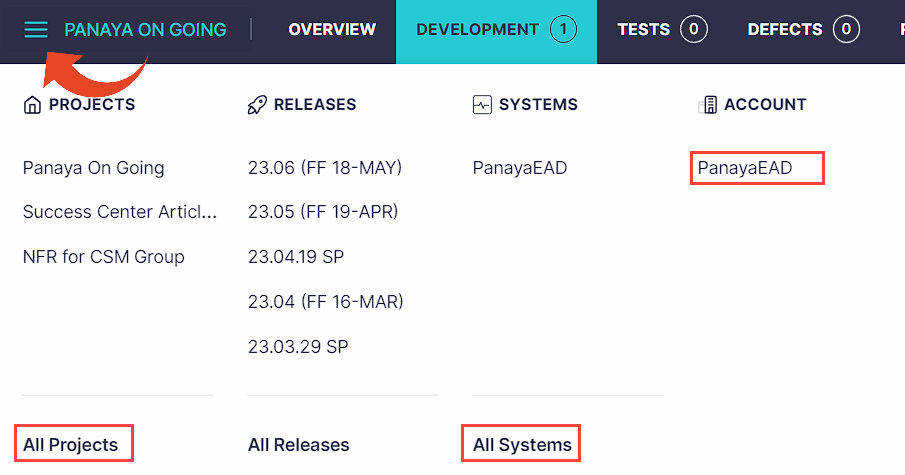
- Click on the Navigation button and select All Projects, All Systems, or your Account Name
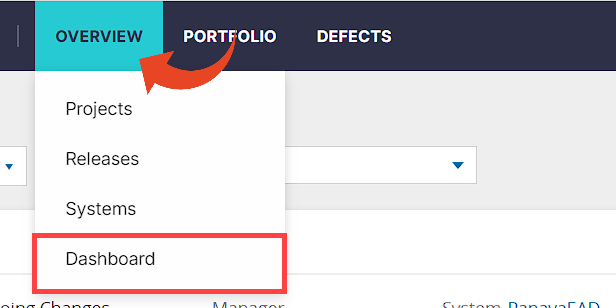
- Hover over the Overview tab and select Dashboard
Filters
You can filter the entire dashboard by System, Project Type, or specific Projects and define activities' time frame and Priority.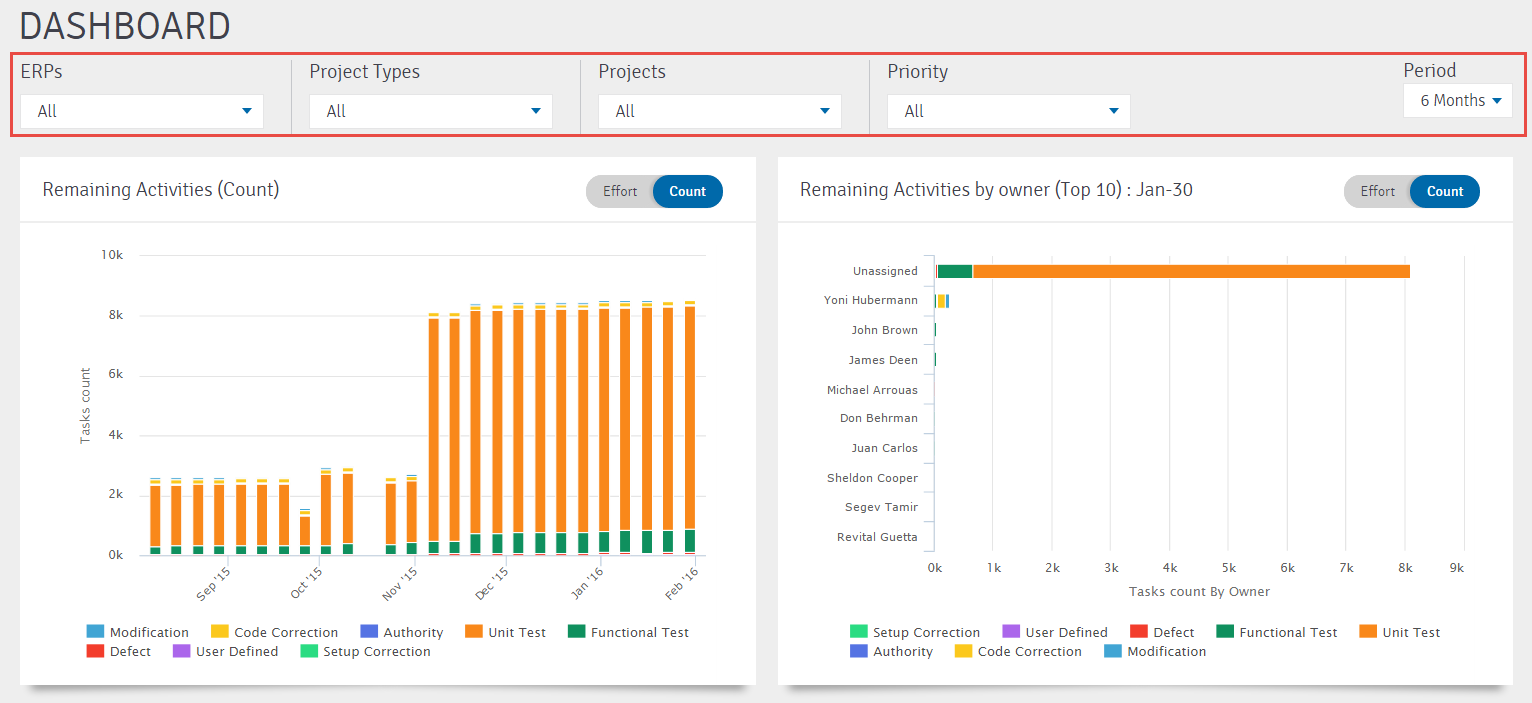
Drill Down
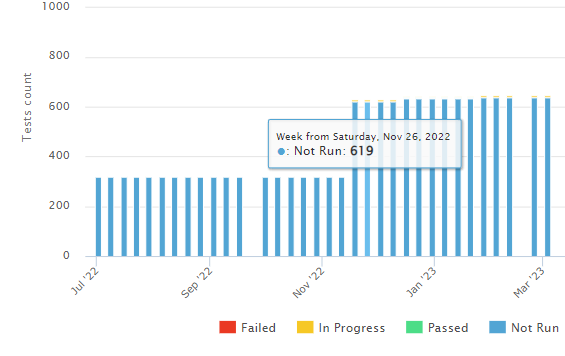
Hover over the graphic data to view more details.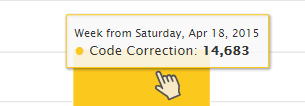
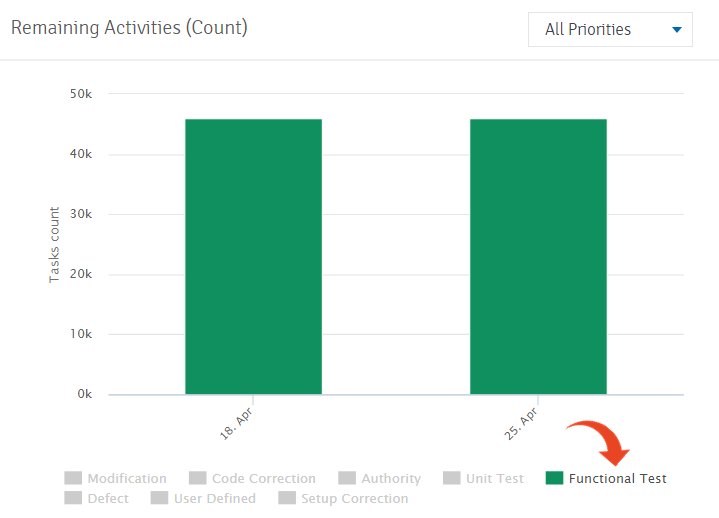
Legend Filter
You can eliminate data for each graph separately by turning the data on or off in the legend.
Good to know!
Weeks displayed in the graphs are calculated from Saturday 00:00 AM GMT until Friday 23:59 PM GMT.