The Development reports section includes the following reports - Overall Progress, Development Progress, and Burndown Chart.
Click on the Reports tab.

Expand the Development Reports section

Overall Progress
This view includes the Overall Progress dashboard and Milestones & Deliverables (Releases) and Efforts & Capacity -- Actual vs. Planned.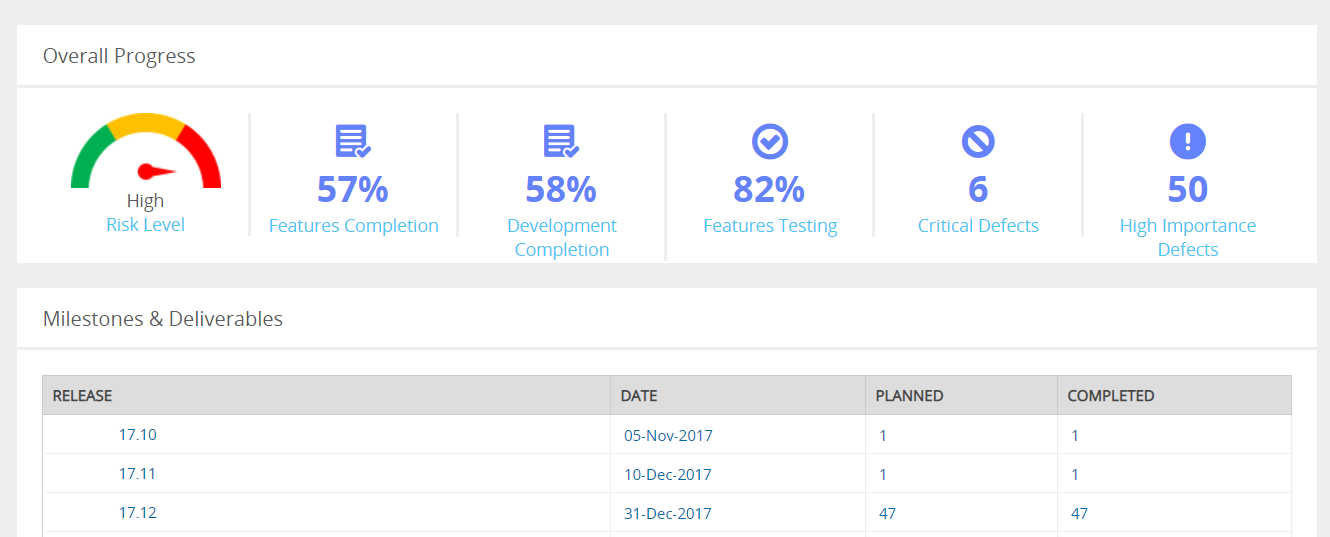
Development Progress
This report allows monitoring the development progress of Requirements / Features.
The aggregation level can be Requirements (Level 1) or Features (Level 2).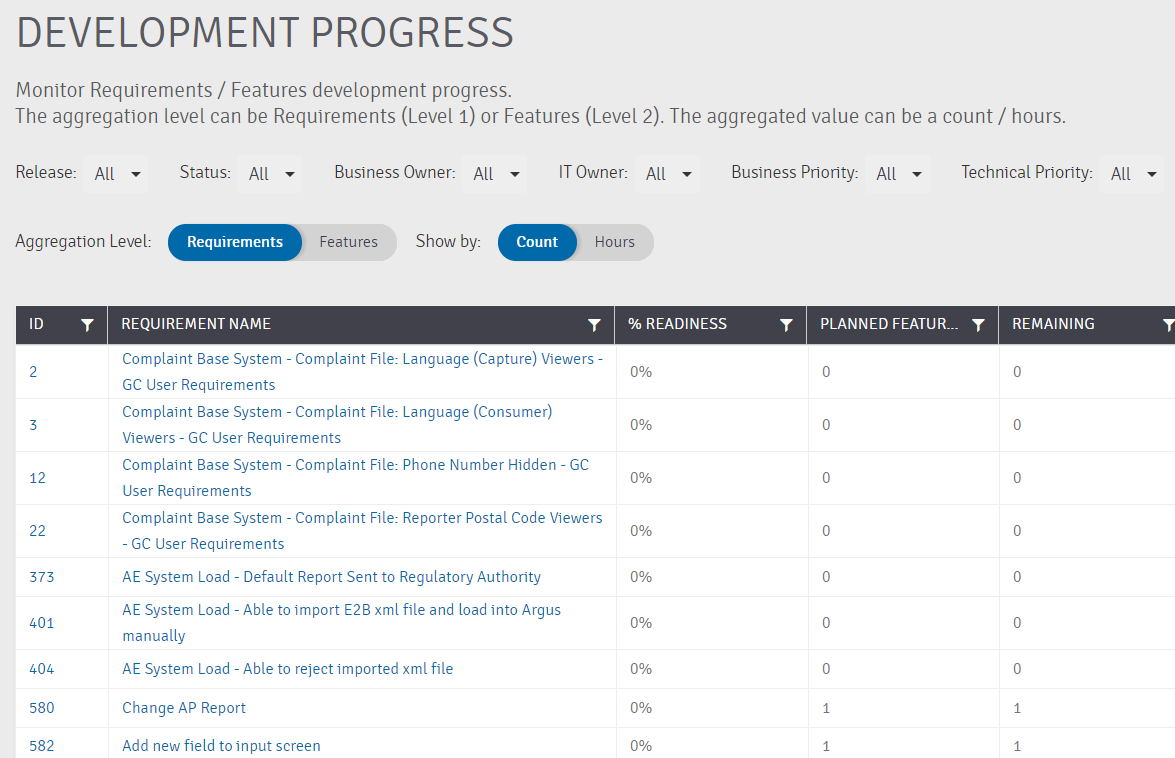
Burndown
Use the Burndown Chart to monitor the development progress across a timeline. The chart displays your planned vs. remaining development efforts in hours.
You can toggle between iterations. Planned efforts are based on the selected iteration start date.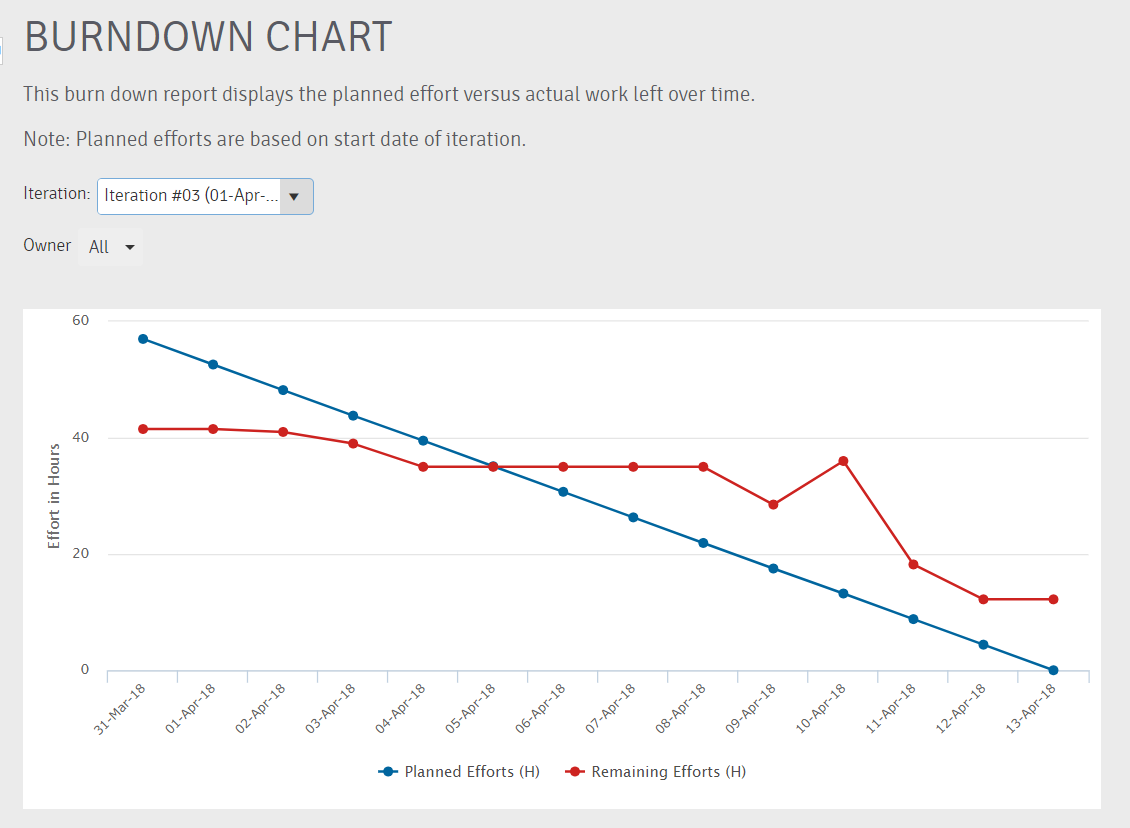
Note
To be able to view the Burndown chart, you will need to populate the Planned and Remaining efforts for your Level 1 activities (typically Requirements or Feature)