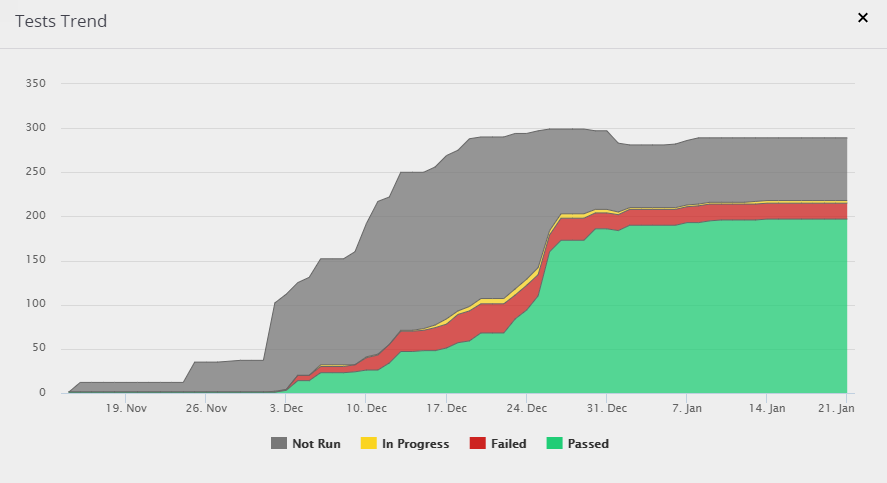
You can view a trend graph of Tests and Test Steps.
From within a Project
Select the Reports tab
Expand the Tests section and select the Tests and Steps trend by status report
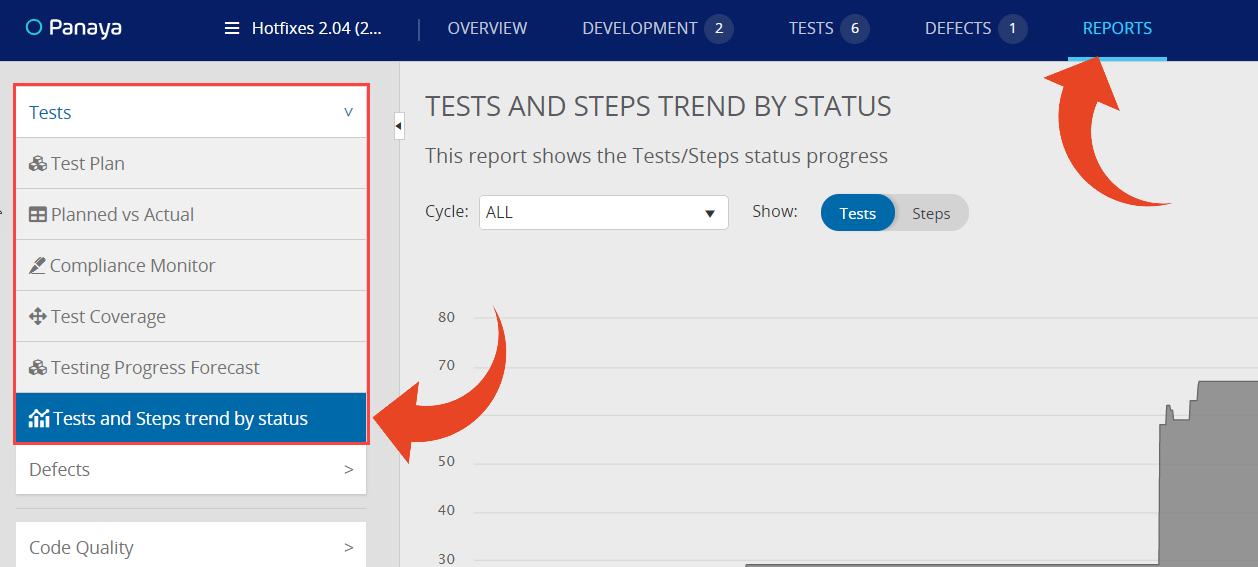
The Trend Graph shows the test activities or Test Steps volume and how many are Not Run, In Progress, Failed, or Passed.
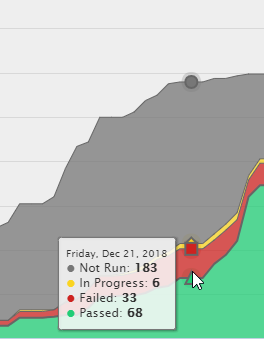
You can hover over the trend lines to view more details.
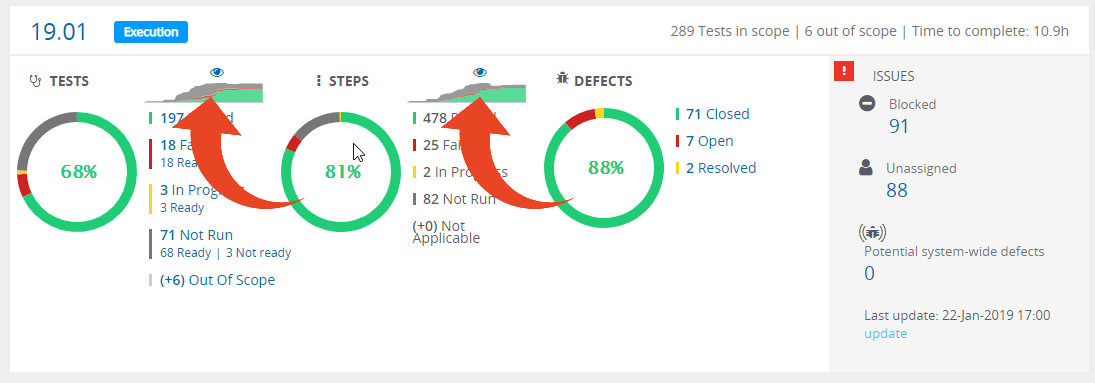
From the Cycles Progress View
You can also view the report from the Cycles Progress View by clicking on the Tests or Steps graph to enlarge.
Good to Know!
Trend graphs are available for Active Projects only.
The information is updated once daily.
The end date of this report is today.