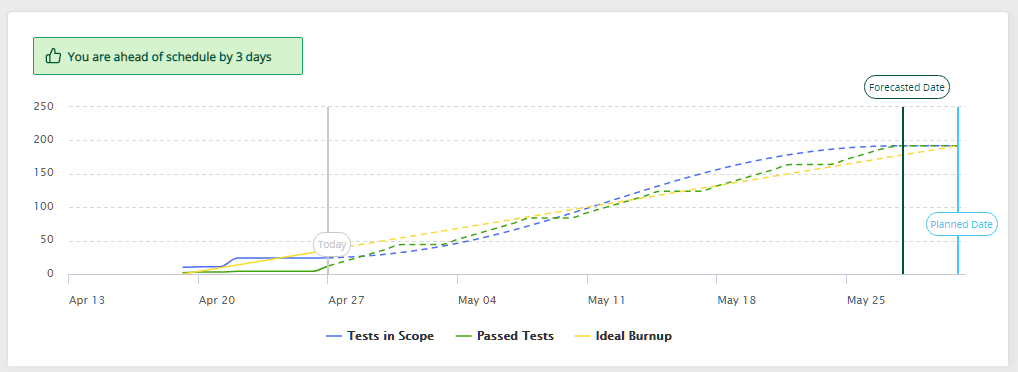
The Testing Forecast widget displays the number of days ahead or behind the planned schedule. When clicked, you will view the progress forecast graph showing the ideal burnup. Pin this new widget to always be in control.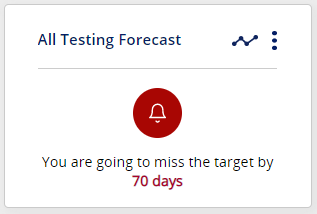
Click on to open up the full forecast report.