- 1 Minute to read
- Print
- DarkLight
- PDF
Debug Run in ScriptBuilder
- 1 Minute to read
- Print
- DarkLight
- PDF
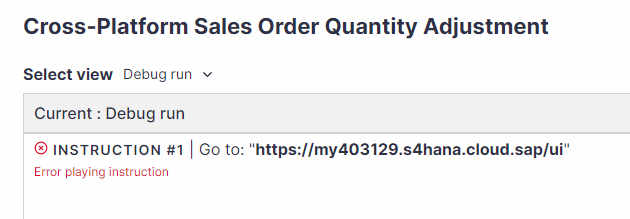
The debug run displays the screenshots and instructions captured in the current ScriptBuilder session. To view the Debug Run results, you’ll need to play the script in the current session. The most common use case is for validating the end-to-end quality of the automated script without affecting the test status in Panaya.

The debug run options allow you to monitor and assess the performance and correctness of your automated script effectively without impacting the test status in Panaya.
Real-time Status Display
When playing the instructions in ScriptBuilder, the status of each instruction is displayed as passed or failed.
The following indications appear while playing the script for each instruction - The instruction is being played
 The instruction has been played successfully
 The instruction could not be played
Viewing Debug Run
Use the Viewer to review the debug run, including statuses and screenshots.
Use the Select view menu in the Viewer to select Debug Run.

Important!
The debug run will be available in the Viewer if the script has been played continuously from the first instruction in the script (Play all).
Resetting Debug Run
To clear the debug run to its initial state, use the Clear execution state menu option. This action will revert the test to its state prior to the debug execution, including the statuses, error message, and locator results for each instruction, as well as all data from the internal parameters table and debug run screenshots.


