Testing Progress Forecast Report
- 1 Minute to read
- Print
- DarkLight
- PDF
Testing Progress Forecast Report
- 1 Minute to read
- Print
- DarkLight
- PDF
Article Summary
Share feedback
Thanks for sharing your feedback!
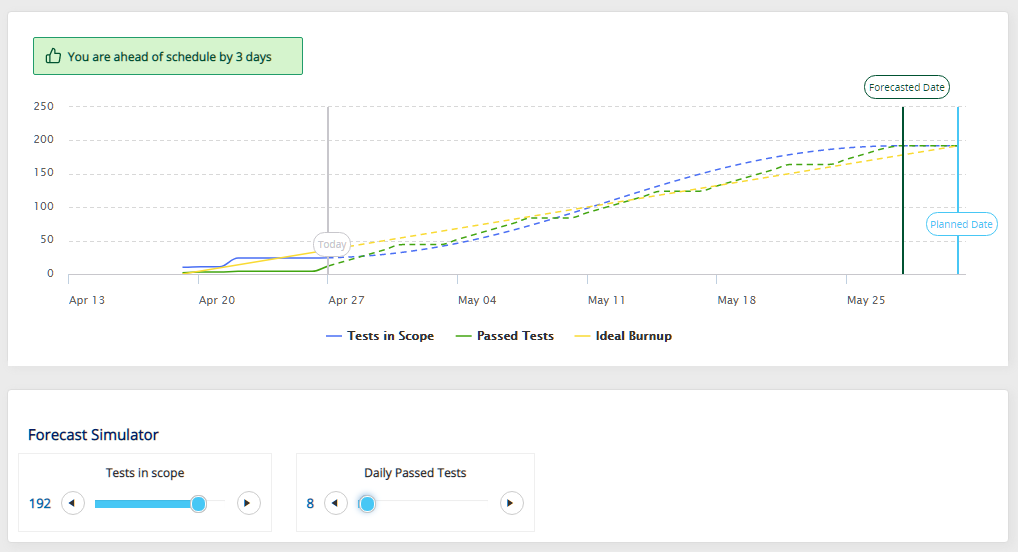
The Testing Progress Forecast Report can help test and project managers understand whether their test cycles are on track based on the current velocity towards the project or cycle end date. Panaya will display the expected delay in calendar days if you are not on track.
📰 Check out this blog post to learn how you can benefit from using this report.
💡 Good to Know
- The planned date displayed in the forecast is based on the Cycle / Project End Date
- The forecast calculation takes into consideration business days only (Monday to Friday)
🤔 No Graph Showing?
- Verify that the relevant Cycles are in the Execution stage and that the Cycle / Project End date is defined.
Click here to learn how to edit the Project details - The forecast can simulate up to 100 days of delay
From within a Project -
- Select the Reports tab
- Expand the Tests section and select the Testing Progress Forecast report
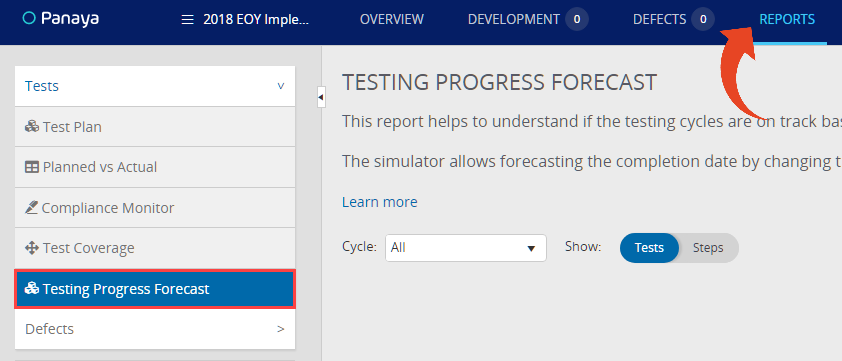
- You can filter to view the progress of a specific Cycle or select All to view all cycles in the current Project.
When selecting all Cycles, the planned end date in the graph corresponds to the project end date.
Use the toggle to change the display between Tests / Steps.

- The simulator below the graph allows you to forecast your end date by changing two parameters -
- The number of Tests / Steps in scope to be tested in your Cycle / Project. This number is the total number of Tests / Steps remaining for today.
- The number of daily passed Tests / Steps, based on your current daily average.
Use these options to review different possible scenarios and take action
The simulator takes into account business days only (excluding Saturday and Sunday)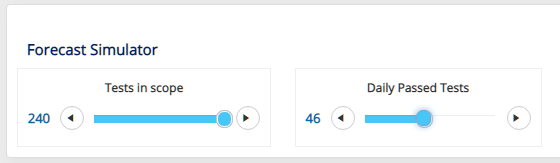


The default values and limits of the forecast simulator -
- Tests / Steps in scope
- The default value is based on the number of tests/steps in the scope
- The maximum value allowed is 10 x the actual number (if the actual number is less than 10, the max value is 100)
- Daily Passed Tests / Steps
- The default value is the actual velocity (based on the number of passed tests/steps from the start date)
- The maximum value allowed is 10 x the actual velocity (if the actual velocity is less than 10/day, the max value is 100/day)